
Day trading Renko charts was actually something I never intended to do. I had been day trading since 1997, first using time frame charts and for most of the time trading with tick bar charts. Additionally, over this same period, I was also teaching a day trading method, using bar charts.
So why start day trading Renko charts instead of trading with bar charts?
When I first started looking at Renko charts, I was attracted to how the Renko bricks were constructed. In contrast to bar charts being random sizes based on time frames and tick counts, each Renko brick was the same fixed amount of price movement.
The Renko brick characteristic of being the same size tended to give the charts a ‘cleaner’ look that was less noisy. After so much time, I was fine was ‘chart reading’ my day trading tick charts. But I also realized this visualization wasn’t as ‘systematic’ to trade and harder to teach.
Considering that day trading Renko charts could be easier to trade and teach than tick charts, I decided to try adjusting our current trading method into a Renko day trading method.
Day Trading Renko Charts
Why Day Trade Renko Charts?
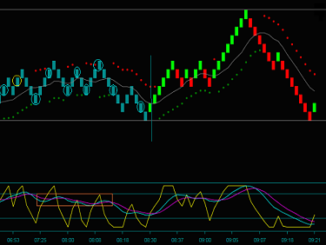
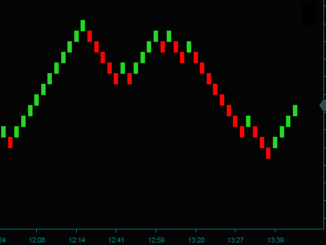
The answer to the question ‘why day trade Renko charts‘, becomes more apparent by looking at the 2 charts below. You are looking at 2 charts, for the gold future contract, during the same time period:
- The top chart is a tick bar chart and an example of my previous day trading chart
- The bottom chart is a Renko chart and the current Renko day trading method chart
After 3+ years of day trading Renko charts, I wonder how I used to trade the tick charts 🙂


Compare the yellow circles on the Renko chart and the tick chart. The tick chart trading method viewed the yellow circles as chart reverses and the yellow dots as the trade setup entries.
I was able to trade-teach why there was a difference leading to price continuation and profitability. If you look at the period between yellow dot2 and yellow circle2, you can see other chart reverses that never led to a trade setup and where trading needed to be avoided.
Some traders in the group could visualize these differences and some had a problem. But regardless, the tick chart method was never as clear as the Renko chart yellow circles and day trading Renko charts.
Be the first to comment