
When comparing Renko charts to candlestick charts, the following question might occur: Are these actually 2 versions of the same chart type?
To answer this question, let’s start by considering the similarities between Renko charts and candlestick charts:
- Both chart types are made from red and green bodies
- Renko charts can have price wicks like the candlestick charts
Besides these 2 visual similarities, Renko charts and candlestick charts are completely different. But more importantly, which type of chart is the best for day trading, the Renko charts or the candlestick charts?
Comparing Renko Charts And Candlestick Charts
The 2 charts below are a 5 brick Renko chart with wicks and a 10-minute candlestick chart. There is nothing significant about the brick count or time frame, other than to show the same downswing and upswing on each chart.
You can see the red and green bodies on each chart, but they are completely different sizes. And you can see price wicks on each chart, but while the candlestick chart can have the wicks on both sides of the body, the Renko chart can only have wicks on 1 side.
Again, other than these very simple comparisons, the 2 charts are completely different. Renko charts are made of fixed price moves and each time this amount of movement occurs, you will get a completed new brick.
Renko charts are made of fixed price moves and each time this amount of movement occurs, you will get a completed new brick. There is no time consideration in the construction of Renko bricks.
On the other hand, candlestick charts are a type of time frame or tick count bar chart and whatever you have used for your chart setting will determine when you get your next candle. Thus, candlestick charts like bar charts are completely dependent on the time frame or tick count.
Renko Charts And Candlestick Charts Differences
Renko Chart – 5 Brick Fixed Size

A 5 brick Renko chart means that each of the red and green bodies has a size that is 5 ticks of price movement:
- A completed green brick closes 5 ticks higher than the open
- A completed red brick closes 5 ticks lower than the open
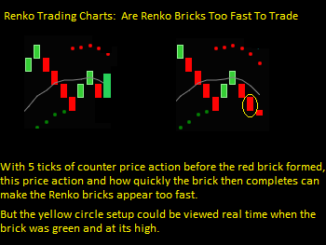
- A green brick can only have a price wick below the open because the brick closes at its high price – a higher price would be part of the next brick
- A red brick can only have a price wick above the open because the brick closes at its low price – a lower price would be part of the next brick
Candlestick Chart – 10 Minute Time Frame

A 10-minute Candlestick chart means that each of the red and green bodies, which are also called candles, has 10 minutes of price movement:
- A completed red or green candle occurs ever 10 minutes
- The candlestick body show the price difference between the open and the close
- The candlestick wicks show prices than are higher or lower than the open and the close – they can be on both sides of the body
- The candlestick body and the price wicks can be of any size
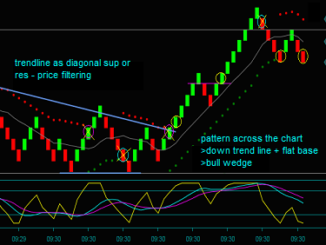
Which Chart Type Is Better For Day Trading
When I started day trading in 1996, I used bar charts and sometimes constructed then as candlestick charts. But then in 2013 I switched from tick bar chart to Renko charts and have never looked back.
I find that the bar charts, whether they are open-high-low-close bars or candlesticks are ‘noisier’ and harder to trade than the Renko charts. And to even further eliminate chart noise, I day trade with the standard Renko bar chart without the price wicks.

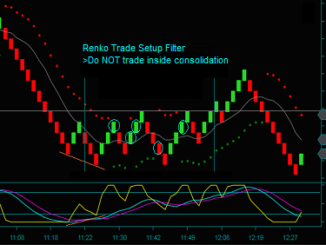
This is my Oil Renko trading chart for part of the period shown in the charts above. I am using a 3 brick standard Renko chart, so it has more bricks and doesn’t span the whole width of the other charts.
The yellow circles are the trades that were done during this period.
The Renko trade setups were clear to see while trading, especially without the further distraction of the irregular candlestick bar sizes and the price wicks. For 3 Renko day trading, I have not found that the extra potential 2 ticks of price wicks affect any of the trading decisions.
So, in light of the differences between the Renko charts and candlestick chart, my choice is that the Renko charts are better for day trading.
Be the first to comment