
I want to discuss Renko price trading strategies and the related Renko chart trade setups for the price failure of resistance and support, along with the breakouts of price patterns and trend lines.
Reacting to significant chart prices and price action trading are extremely important to the profitability of our trading method. Although our basic Renko chart trade setups may be indicator and momentum combinations, all trades are affected by key chart trading prices and the related price action when they are tested.
Read More: Renko Chart Trading Setups
Consider the following concepts:
- What are significant Renko trading prices
- How can a trading price be a trade entry filter, but also be a price failure entry set up
- Trading patterns and trend lines and price action breaks
We are looking at an Oil Renko chart, which is a three Renko chart, meaning that each of the bricks has three ticks of price movement.
Before you could get another brick you have to get:
- An additional three ticks of price
- Either a green brick three ticks higher than the high of the previous green brick high
- Or a red brick after a green brick has to be three ticks lower than the low of the green brick
Read More: How Renko Chart Bricks Are Made
Renko Price Trading Strategies Setups
I will be discussing the oil chart for a series of Renko price trading strategies. These will include the difference between a trading price filter and a price failure, along with price action breakout trade setups.
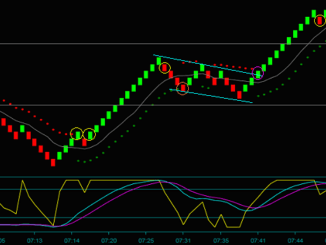
On the chart, you are looking at the bottom gray line in particular, because that’s going to affect where we are trading. This price is the overnight low, which is support and certainly an example of a significant Renko chart trading price – clearly, we have to break through that line before a short sell trade could be profitable.

Price Filter Or Price Failure?
This support price is going to act as a trade entry filter in our method because we will not take a trade that does not have at least three bricks of room to price.
So the price envelope reverse, which would be a sell that occurred at this blue circle is only two bricks of room to price so that trade isn’t done.
You can see that price does move through support, breaking the low and going to lower lows – but is there a trade set up to enter the move? I mentioned price failure entry setups earlier, where failure would mean that the Renko trading support fails to remain support.
We have a price failure entry setup of the support price. Also, there is a price action trading pattern setup and it’s a trading pattern that I happen to love.
Renko Trading Price-Pattern Combination Setup
Look at the Renko bricks around the price:
- The two red brick price breaks
- How break one was a higher brick and then break two came from a lower break
- The indication of failure comes from the triple break of the 2 bricks with yellow squares
- Enter the sell at the yellow circle as a combination price failure break-price pattern
We see these Renko price trading strategies regularly, where a trade setup combines a price failure with a related trading pattern break, and they are typically profitable. The concept that entering a trade when a price that should be support or resistance fails is a high odds trade.
So after not being able to go short at the blue circle. I am short at the yellow circle we go down and then after we go down and going down for bricks, brick one brick two brick three brick four does give us a base partial in our method and then you see you go red, green, red, green, red, okay are you looking at the same pattern.
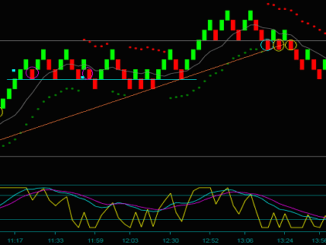
Is This Also A Price Pattern Break Setup?
I just showed you where the price pattern break two bricks as an add-on set up – is the orange circle based on a similar price action pattern?
- We talked about a price failure being part of the break pattern, and there is no related trading price
- Additionally, this would be a trade without a fast or slow momentum component
This is just a swing down, with alternating green and red Renko bricks. There’s no support price that is failing so that component is missing. And having the price action combination of a higher-lower brick into the break is also missing.
No, we don’t have the same Renko price pattern trade setup as the yellow circle sell.
Further Considering Momentum In Price Failure
When I compared this pattern to the price failure pattern break at the yellow circle, I said, we also didn’t have momentum. Specifically, what do I mean by that?
If you look at the yellow line below the chart that’s fast momentum. We want what we call a fast momentum hook as part of the price failure,
If you will look at the first orange square you can see how that syncs with the right yellow square on the chart price – that is a fast momentum hook:
- Fast momentum has just broken through the lower extreme
- It then goes back above lower extreme to the middle area
- And then it breaks the lower extreme line again – that is a momentum hook
I want you to now look at the orange circle – do you see the same hook again?
The answer is very clearly no, we never even broke through the lower extreme. And even if we did, you can see that fast momentum is above the extreme line at the time we would have entered a sell at that orange sell circle your own circle.
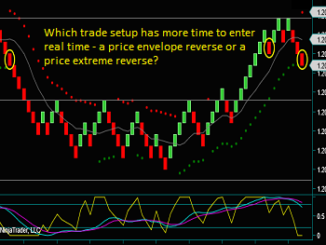
Renko Trading Strategy – Trend Line Breakouts
We make a new price low as a double bottom. Typically I would go long where the orange circle is marked, but the Renko chart read at that point is that we are inside of consolidation.
However, that changes with the green-red-green brick pattern. You can see the higher low is with the build of slow momentum and then there is a fast momentum hook – the yellow circle became the Renko buy entry.
When we get back to price resistance, we pretty much explode through it like it wasn’t there. Except, by not being long the orange circle, there is no add-on trade that takes advantage of all the price movement after the breakout.

Horizontal-Diagonal Renko Trading Price Breakout
The last Renko price trading strategies I want to talk about are trend lines and the horizontal-diagonal breakout trade setup.
You can see the start point and point two of the trend line [purple line], and if we keep extending the line to the right it will end at the overnight low price support. Let’s also overlay a purple line at support, and what do you see at this point?
The purple circle is the intersection of the Renko trend line with support at the horizontal line and what I refer to as a horizontal-diagonal. And when price moves through the intersection, 2 price lines that could be resistance now give a breakout pattern trade.
So after you break through the horizontal-diagonal price lines, I am going long the yellow circle and that yellow circle became my add-on trade for the breakout to upper chart resistance.
Renko Price Trading Strategies Video
Click the link below to watch the trading video, which will further discuss the charts and the Renko price trading strategies. Additionally, the video is going to discuss the management of this last breakout trade – and especially how a method base profit of 4 bricks was expanded to the blue square at the resistance price.
Click link to watch video: Renko Price Failure And Breakout Trading Strategies
Be the first to comment