
In this Renko trading prices article and video, I will discuss the significance of Renko prices to our charts and use them in our trading strategies. And then, after identifying the Renko prices that will be used in the range we are trading, we will continue to move the chart to the right and determine the following:
- Do these Renko trading prices remain relevant for trading
- If a price is not still relevant, how should we adjust the chart for new Renko prices
- Are there any additional prices that should be added to the chart
As you know, chart price is a critical aspect of trading our Renko strategies:
- Price is a trading filter based on any possible trade setup. For example, we may have how much room we have – if there aren’t at least 3 Renko bricks of room, then we don’t take the trade.
- You have also seen how price can be part of a trade setup, which is a very important part of a Renko trade setup – because if you get a resistance or support price that fails to be support or resistance any longer, the trading through those price points is likely going to give you continuation and profitable trade.
In this capacity, using trading prices is quite simple. But selecting the Renko trading prices and determining their continued significance is not so simple in many different situations.
Renko Trading Prices And Related Trading
This is why I try to talk about the trading chart prices in almost every Renko training video because if there is a price that I know or think might be difficult to locate, then I want to discuss it. To the extent possible, I would like us all to have the same basic trading prices marked on our charts.
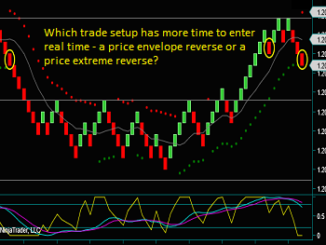
When you look at this trading chart, you should see two gray lines at the bottom. From this chart section, you have no idea why they’re on the chart, but this will be discussed further.
The 2 Renko trading prices identified by the purple lines should be obvious:
- The daily low was the top purple line to the left of that vertical line where the session break occurs. And then, you can see that this price line breaks to a lower low, which shifts this Renko trading price to resistance.
-
After we get a chart reverse instead of another low price in a sell swing, the bottom price line becomes new chart support. We now have identified 2 significant Renko prices, and we will have to trade our setups according to the room to these prices.

Renko Chart Trading Inside Of Support And Resistance
- Orange circle1: Price envelope reverse and a Renko setup that would be traded. But this trade would be filtered for price resistance, and you can see the reaction and why we use price filters – resistance rejects, and a losing trade was avoided.
- Yellow circle: Price envelope reverse with trading room to support. Unlike the filtered buy, this setup would be traded based on the room to the Renko support price.
- Orange circle2: Midline rejects with slow momentum flow and a fast momentum hook. This is a Renko addon setup with 3 bricks of trading room to support, so this is not a filtered trade.
- But based on the overall sell direction, you might make the decision not to make an addon trade with only 3 bricks of room to the Renko support price that is also the daily low – you might want to get your 4 brick partial profit at support and trail the remaining short contracts.
So, the 2 purple Renko trading prices and related trade prices were clear. And in most situations, we can identify support and resistance prices like these. What becomes more difficult is the decision to keep these price lines on the chart as we continue trading.
What becomes more difficult is the decision to keep these price lines on the chart as we continue trading. For example, we know that the top purple line is Renko resistance, but what if the bottom line breaks and we go to a lower low – what happens to the price line when the lower low price becomes support, and what was support becomes an inside price to the Renko chart range?
Renko Trading Price Strategies
Renko Trading Prices Identification And Significance Video
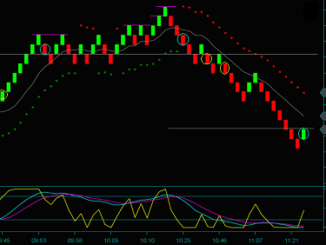
We have moved across the Renko trading chart to the yellow circle price envelope reverse buy – what has happened to our left side Renko trading prices:
- We have never traded as high as the top gray line, so it remains a resistance price
- The bottom gray line trading price is the new chart low, so it becomes a support price
- But what about the previous support price, which is now the middle gray line – has this price remained chart relevant where it should remain on the Renko chart as a trading price, or should it be removed from the Renko chart?
- And what about the purple price line? Should it be added to the trading chart?
- This price isn’t a new high or the swing high into a lower price low. However, it is the price high after a news release.

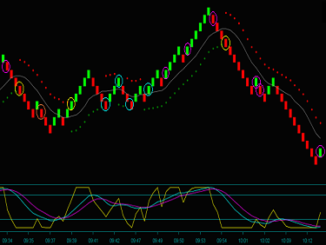
The Renko trading price video will discuss the movement from chart1 to chart 2, along with the questions asked above.
And then, in another video, I will discuss our Renko trading strategies to the right of the yellow circle. After that, we will continue to talk about trading price identification and continued relevance, along with more discussion on Renko price pattern breakouts.
Click the link to watch the video: Renko Chart Trading Price
Hello Barry
Thanks for the feedback.
I want to subscribe to your Renko-trading-strategy but just want to make sure if I can use Icmarkets MT4 and will the indicators work on Mt4. Please let me know I am very interested to sign up for this coarse?
Thank you, but my indicators have only been coded for ninjatrader and tradestation – my recommendation for Renko chart trading and what I am using is ninjatrader. Any videos that you watched from the website are from ninjatrader charts.
Good day, Where can I get this indicators?
Jannie, the indicators are part of a Renko training service. You can find more information about this on the following webpage:
https://renkocharttrading.com/renko-chart-day-trading-strategies/