
Renko Chart Momentum Trading Indicators
The Renko chart momentum and indicators used for trading the Renko method are based on the following concepts:
- Momentum breakouts lead the price direction and price continuation.
- A reverse in the direction of the price often follows momentum extremes or divergences from the price.
- Momentum indicators work well for Renko chart day trading.
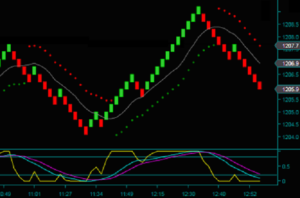
- Price envelope made by the red and green dots on the Renko chart. The dot color change is based on the nine-period average of a medium-speed momentum indicator crossing zero.
- The chart is in sell mode when the red dots are on the top. And the chart is in buy mode when the green dots are on the bottom.
- The blue and purple lines below the Renko chart are slow momentum oscillators. There are multiple ways to use this momentum indicator in Renko trading.
- A cross of the blue and purple lines with the price envelope direction shows the flow of slow momentum.
- The movement of the blue and purple lines to a momentum extreme can also indicate a price extreme.
- When the price makes a higher high, but slow momentum makes a lower high [or the price makes a lower low and slow momentum makes a higher low], slow momentum is divergent to the price. Conversely, a reverse in price often follows a price-momentum divergence.
- The yellow line seen below the chart is a fast momentum oscillator.
- This Renko chart momentum indicator moves quickly from extreme to extreme. One of its primary uses is for seeing the resumption of price direction after a retrace.
- A ‘fast momentum hook’ trading pattern is a trade addon setup.
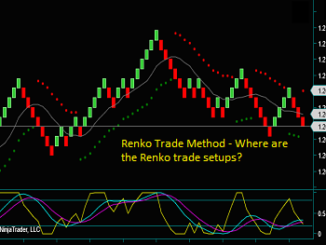
Renko Chart Momentum Trade Setups
The chart is now marked with the trade setups for the Renko chart trading method. Now read the indicator, momentum, and trade setup components discussion.
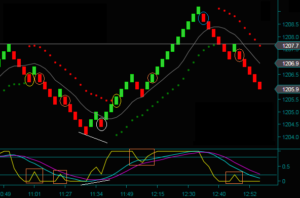
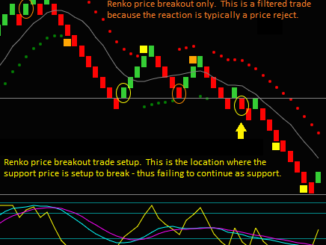
- Price Envelope Reverse [yellow circles]: (1) price envelope dots shift from green to red or red to green (2) the blue line is below the purple line for a sell or above the purple line for a buy; this means that momentum has crossed zero.
- NOTE: If you are wondering why the price envelope reverse after the blue circle is not marked, the reason is that it’s a Renko method filtered trade. The trade would occur on the horizontal line, which is a support price. Trades need at least three bricks of room to price support or resistance.
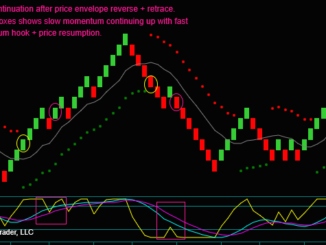
- Midline Reject [orange circles]: (1) price retrace to the gray midline inside the price envelope (2) the blue and purple lines continue in the direction of the trade (3) fast momentum hook [orange boxes].
- These are Renko chart momentum addon setups: (1) slow momentum can continue on a retrace, which is called momentum flow (2) the fast momentum crossing above [below] the extreme line and going to an extreme again shows the resumption of momentum.
- The white circle is not a midline reject trade setup: (1) the pattern has not been completed at this brick (2) the trade would be into a price momentum divergence [see the white lines], where slow momentum is a rising higher low.
- Price Extreme Reverse [blue circle]: (1) The price has moved five or more consecutive bricks from the last trade setup (2) the blue and purple lines are both above or below the extreme line.
- This Renko setup is a reversal trade. The trade setup is based on the price and trading momentum reaching a chart extreme.
Renko Chart Trading Method
The Renko chart trading method and momentum trading indicator training include:
- Renko chart momentum reverse trades that begin a new directional swing.
- Trading pullbacks with momentum resumption and flow for price continuation.
- Trading swing reverses with price and momentum extremes or divergences.
Be the first to comment