
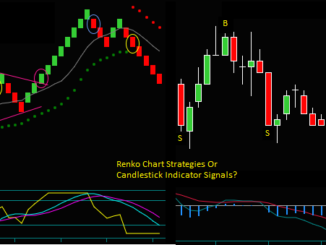
There are Renko chart trading strategies that make our ‘base’ day trading method more consistent. Among these, adding price resistance and support as filters is very important. Renko chart trend line and pattern breakout setups also add to the effectiveness of our day trading method setups.
I am going to do a trade review for the charts below. It will discuss how our Renko trading strategies affected the outcome and timing of the trades. There is a link to a video that will talk more about these strategies.
You are looking at a Renko day trading chart.

Renko Trading Prices
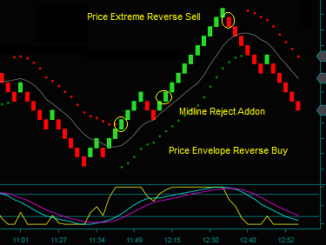
I will ask you first: Why not go long on the price envelope reverse [blue circle1] but go long at the Renko brick midline reject [blue circle2]?
Well, your first thought might be that you are looking at this orange line and thinking that this is a Renko chart trading price line. I agree there’s a price action-reaction at this price:
- A price low is where the line started. And then, there is a break of the line to the downside, followed by a retest and reject. The price then went down again.
- So the price has shift line properties, where support shifted to resistance. But besides being in this area, this price was not left-side resistance and moved across the chart.
Or you may think the gray line is a left-side price that could have been the high, followed by a break out to a higher high. Or this could have a price low that broke out to lower lows.
- But if that’s the case for blue circle1, it would have also been the situation for blue circle2 – both potential trades would have been price filtered because there are less than 3 Renko bricks of room to the trading price.
Renko Trade Setup Filters
So neither of these is the answer; what else could have been a trade setup filter?
Before I go on, let me go ahead and mark the trading prices that do belong on the chart:
- The top gray trading line is the price high from the previous day – note that the downswing to this area started from that price
- The bottom gray trading price line hits as a double bottom, as well as being the low before the move to the high – both of these are relevant prices in the Renko day trading method.
As you can see, neither of these prices would be trade filters for either of the blue circles. Let me draw another line on the chart to answer the trading question.
Renko Chart Trend Lines
Look at the orange downtrend line; it will be clearer when you watch the Renko video discussing it further. Using trend lines when trading goes back to our recent trading video, talking about trend lines, Renko chart pattern breakouts, and the Renko chart trading strategies for diagonal support and resistance breakouts.

In this case, the price envelope reverse goes directly into the trend line. You can see the reaction there, how the price was rejected, and a good example of why we use Renko chart trend lines as price filters. But then you see the trend line break2 with MEx flow [slow momentum] and the fast momentum hook.
And that is why blue circle2 is a Renko day trade, but blue circle1 is a filtered trade. Renko chart trend lines are thus filters when tested and then trade entries when the line fails as resistance or support.
Renko Chart Trading Patterns
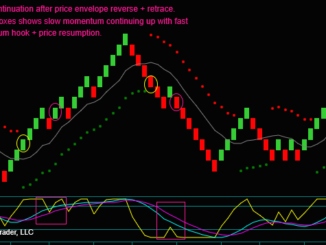
Now, I want you to see one more trade setup using Renko chart trading patterns. This is a W pattern [you can see this in the yellow W drawn on the chart] done as a buy; there is a similar M trading pattern, which is a sell – look at the components of this pattern day trade that was done as an addon to the blue circle initial trade:
- Yellow squares double top and double bottom
- The double bottom is additionally important as a price rejection of support
- Slow momentum rising along with a fast momentum continuation hook
- Enter the trade as a triple break with continuing momentum
Renko Chart Trading Strategies Video
The video will discuss the Renko chart trading strategies. These include using trading prices, trend lines, and chart patterns. Also reviewed are Renko trades and management for the charts above.
And I will answer a trade management question for increasing profit size. The trading strategy for doing this is called diagonal breakout potential.
Click the Link To Watch the Video: Renko Trading Strategies And Trade Review
Be the first to comment