
In order to better understand Renko charts, I want to explain making Renko bricks and how each new brick is made.
As you can see in the chart below, a Renko chart is a group of down bricks and up bricks, with each brick having the same size. For instance, our day trading charts all have 3 ticks or 3 points, which is determined by what is being traded. When oil or gold Renko trading the bricks will have 3 ticks, but if trading the emini dow jones, the bricks will have 3 points.
This fixed Renko brick price symmetry gives the charts their clean look and helps to remove the noise from the chart – but how is each new renko brick made?
Making Renko Bricks
You are looking at NinjaTrader Renko charts. These are gold charts, so I know that each brick must have 3 ticks of price for a new Renko brick to be made.
I made a screen prints of the charts, before the last brick was completed – further note that you are looking at Renko bricks that are counter in direction to the previous brick.

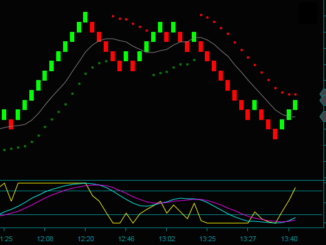
Renko Chart Section A
When looking at chart section A, it is clear how consecutive bricks of the same direction are made. This is a down brick, so it opened at its high and closed 3 ticks lower. The following brick is also a down brick, so it opens at the low of the previous brick, and also closes down 3 ticks and another red brick completes.
The confusion is when the next uncompleted brick is going in a different direction [section B and section C] than the last completed brick. Again, these are NinjaTrader Renko charts and all charting programs may not show uncompleted bricks like this – but I am using this program for Renko charting as are most of the traders in our group.
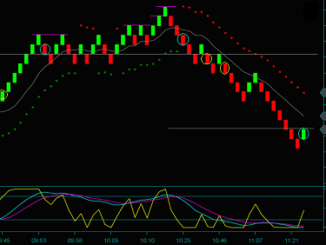
Renko Chart Section B
Look at the small chart inset marked B, where the last completed brick is red. Does it then look like the green brick next to it is bigger, and if so why isn’t there a new green brick?
This actually isn’t the case. The brick is green because there has been a up tick, so it is higher than the red brick closing low. You can see this 1 tick of up movement, when you compare the uncompleted green Renko brick to the high [open] of the red brick.
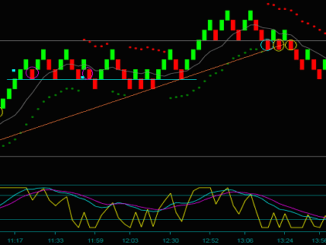
Renko Chart Section C
Now look at the main chart, starting with the same low red brick, followed by a completed green brick. Do you understand how this completed green Renko brick was made?
There were 2 more up ticks so the brick completed, which also means it is 3 bricks higher than the high [open] of the red brick.
The last brick [C] on the chart is red – what has to happen to make it complete? There are already 2 down ticks, so 1 more down tick will give a completed red brick – this is the same way that the first red brick [A] in the down swing to the low, looked like at one point.
However, this brick could still complete green. What has to happen to make this become a completed green up brick? You first have to go up 2 ticks to make this brick even, instead of 2 ticks down – and then you have to have 3 up ticks to get a completed green brick.
Knowing how Renko bars are made is also very useful for executing a trade. For instance, let’s say that when I look at my trading indicators, I can see that a buy setup will ‘trigger’ if the green bar completes.
Since I know what price that will be, I can put a stop-limit buy there BUT if the brick completes red, simply remove it from my chart.
Making Renko Bricks Video
Does this all make sense? If not, it really won’t be complicated after you focus on making renko bricks on your chart.
When you watch the video, I will further discuss these charts along with marking them for how the bricks complete real time.
Click Link To Watch Video: Understanding Renko Charts – How New Renko Bricks Are Made
Be the first to comment