Renko Chart Options Position Trading
Renko chart options trading is our position trading method for underlying trading. An underlying is the basic security that gives a derivative or option its value.
Our Renko options position trading method has 2 primary objectives:
- Using at the money options to position trade the SPY or QQQ underlying.
- Selling out of the money put and call options for income.
In this post, I want to discuss the first objective, using options for position trading the underlying. Questions to answer include:
- Does Renko chart options trading have any cost advantages over underlying trading?
- Are there any downsides to position trading options instead of trading the underlying?
- What risks are there for trading options?
Renko Chart Options Trading Cost Advantages
Consider the SPY at a last price of 440.61. If you buy 100 shares, it will cost you $44,061. On the other hand, you can control the same 100 shares with options in 2 ways:
- Buying 2 at the money calls [11/17 expiration]. You will have a position curvature of 100 deltas [like the 100 shares], but you could buy the calls for 2.90 or a total of $580.
- Buying 1 at the money call and selling 1 at the money put [11/17 expiration] will also give you a position curvature of 100 delta [known as a synthetic position – see below].
- But you could do this trade for .60 or a total of $120.
Synthetic Options Position Trades
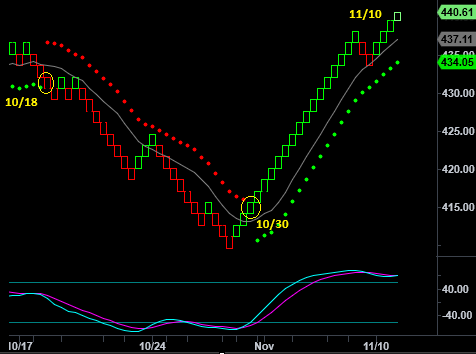
The chart above shows two recent Renko chart position trades for the SPY. You would first make a sell on 10/18 and then reverse it to a buy on 10/30. The 10/30 Renko buy was still open on 11/10.
You would use options to make the Renko chart position trades in the chart above. We call these option trades synthetic trades because they use options to replace the underlying trade.
The Renko synthetic option trades combine long or short puts and calls to emulate the same price movement as the underlying.
- Synthetic option buy: buy a call and sell a put.
- Synthetic option sell: sell a call and buy a put.
Can A Renko Chart Option Position Emulate The Underlying?
Although a Renko option position can provide the same deltas as the underlying at a far lower cost, can it also give the same position profit?
Let’s look at the Renko SPY position trade profit graph from 10/30.
The first thing you notice on the position curvature chart is that the 2 lines are virtually the same. This shows how the synthetic option position emulates the underlying.
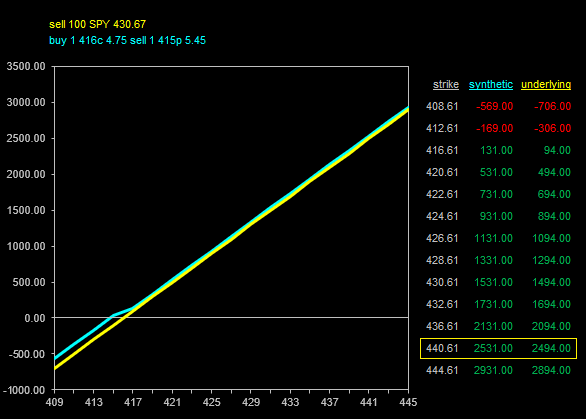
Now look at the profit graph. Consider that you went long on at a SPY price of 415.67 but bought 1 416 call and sold 1 415 put for the 11/10 expiration.
- Buy 100 SPY at 415.67 – the profit at 440.61 = $2494
- Buy 1 416 call at 4.75 – the option profit at 440.61 = 24.61 – 4.75 = $1986.
- Sell 1 415 put at 5.45 – the option profit at 440.61 = 5.45 – 0.00 = $545.
The SPY underlying trade gained $2494, while the options synthetic trade gained $2531. In this case, the Renko chart options position trade actually made more than the underlying.
How was the synthetic options trade more profitable than the underlying trade?
By buying a call at 4.75 and selling a put at 5.45, you executed your synthetic options trade at a .70 credit to the cost of the SPY buy price.
Since you made the Renko synthetic options trade at a credit, it was more profitable than the underlying trade. If you had done the trade at a debit, the underlying trade would be more profitable by that amount.
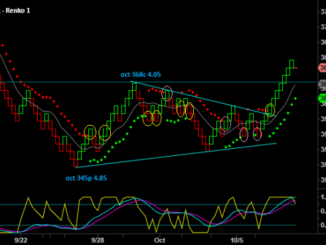
Renko Chart SPY Position Trading Strategies
Downsides To Renko Chart Options Trading
Although these Renko chart options trading positions were longer than average, it is important that the Renko method could stay in the position for almost all of the swing.
As we can see on the chart, this was not a problem. However, there are other downsides and risks to Renko chart options trading position trades to consider.
Are You Approved To Sell Short Uncovered Options?
You cannot trade these Renko chart options trading strategies unless your account has approval to trade them, which could be a downside.
However, you also cannot Renko position trade the underlying unless your account has approval for making short trades.
So, this is not an option trading downside when compared to the underlying. And there are alternatives to going long or short without selling options. You could buy puts and calls if necessary instead of making synthetic options trades.
Options Expiration
However, 11/10 is expiration for the options expiration, and the Renko position buy has not reversed. If the swing continues, you will not be long unless there is another buy setup for an 11/17 option.
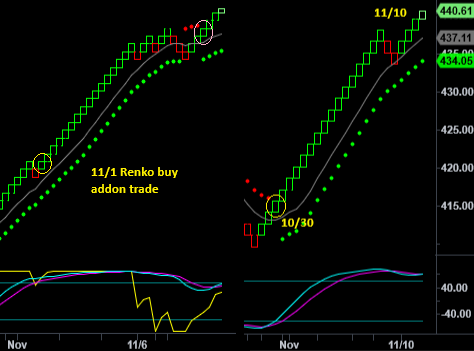
- Right Chart: Renko Spy 1.5 point brick setting.
- I say the swing is still long because although there were some red bricks, there was never a price envelope dot shift from green on the bottom to red on the top.
- An 11/17 option would be bought if there was a Renko addon setup resuming the swing – there wasn’t.
- Left Chart: Renko SPY 1-point brick setting.
- We use the 1 point chart to trade with the swing direction of the 1.5 point.
- Look at the yellow circle; this is a Renko buy addon trade.
- But the date was 11/1, and the 11/10 expiration was bought, so this trade would also expire.
- You can see that the chart did reverse and then reversed back at the pink circle.
- This would be a setup to buy an 11/17 option. However, the pink circle is not a Renko price envelope buy because slow momentum had not crossed back.
- We use the 1 point chart to trade with the swing direction of the 1.5 point.
Expiration can be a downside for Renko chart options trading positions.
I will say that this is rarely an issue as most Renko swings last less than 7 trading days, and we look to trade options with around 10 days to expiration. It was not an issue for the Renko sell swing from 10/18 with 10/27 expiration options, which was 8 trading days.
The current Renko Spy buy is one of the longest swings I remember. And this time, there is an issue, with the only alternative being to buy an 11/17 option regardless that there is no Renko option trade setup.
Options Exercise And Assignment
I have discussed the risks of the exercise and assignment of options many times on this website and will continue to do so.
Not understanding exercise and assignment would be a big downside to Renko chart options trading position strategies. And note that there are risks from long and short options, along with debit or credit option spreads.
- If you let a long or short option expire in the money, your broker will exercise the option, and you will become long or short the underlying.
- For the Renko option buys discussed above, if you did not sell the options to close before or at expiration, you will be long 100 shares of the SPY at the strike price for each option.
- For instance, what would happen if you were long 2 11/10 416 calls?
- Your broker would exercise the calls, leading to your assignment and a long position in 200 SPY shares at a total cost of $83,200.
- If you were short an in the money call at expiration, you would be short SPY shares at the strike price.
- For the Renko option buys discussed above, if you did not sell the options to close before or at expiration, you will be long 100 shares of the SPY at the strike price for each option.
- And this could be the case for option spreads if 1 of the options expired in the money and 1 of the options expired out of the money.
- The out of the money option will expire worthless, while your broker will exercise your in the money option, leading to an assignment.
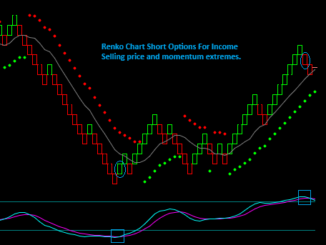
Renko Options Selling: Short Options At Expiration
Renko Chart Short Options: Risks Of Selling Options
I want to assume that no one would trade options without understanding exercise and assignment, and my strongest recommendation is that you don’t.