Renko options trade review for position trading. The Renko chart discussed is my options position trading chart for the QQQ, with a brick setting of 1.5 points.
The QQQ Renko charts with this brick setting tend to have 2-4 bricks daily. You can compare this to a trading day of 360 minutes [8:30 am to 3:00 pm central time] and see that they are slower than a 60-minute bar chart.
I want to review 2 different types of Renko options position trades:
- Options income trades selling out of the money options. The income trades are longer-term, using monthly expirations.
- Options directional trades using synthetic positions for the underlying. The synthetic trades are short-term, using weekly expirations.
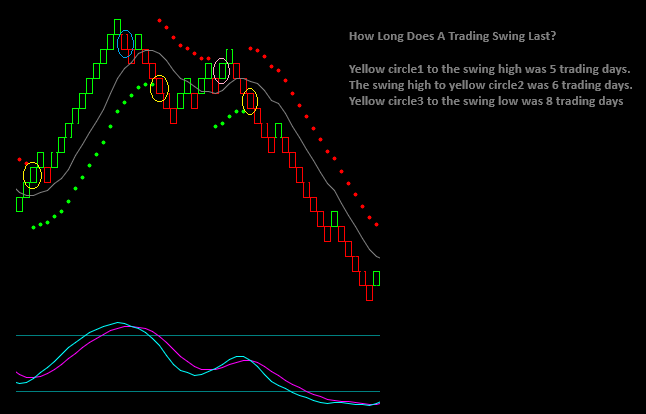
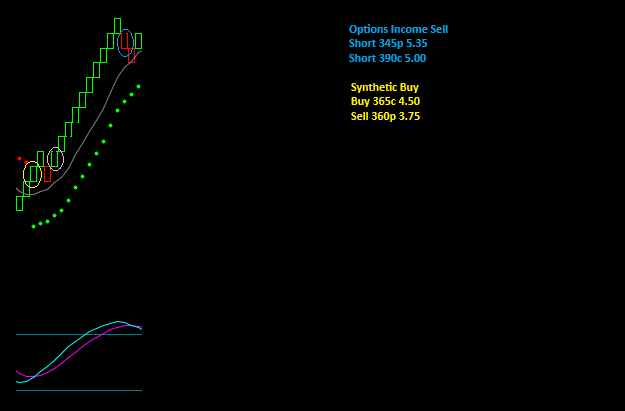
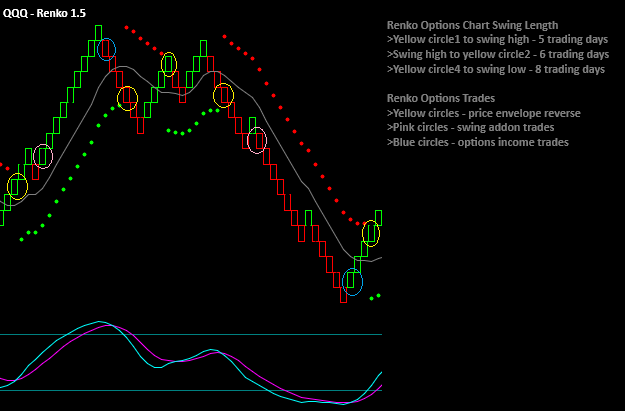
Here are examples of the relative swing length for the QQQ Renko position chart:
- Yellow circle1 to the swing high was 5 trading days.
- The swing high to yellow circle2 was 6 trading days.
- Yellow circle3 to the swing low was 8 trading days and one of the longest swing lengths.
You can see that the number of bricks in a swing doesn’t necessarily relate to how low it will last. For instance, the first swing is shorter than the reverse, but the move had twice as many bricks.
Your understanding of how long these swings last is important for selecting the expiration dates for the weekly options. You would not want a Renko options trade to expire in the middle of the swing.
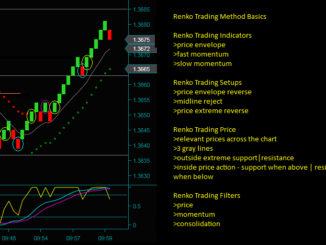
Renko Options Trading Indicators
The Renko chart trading indicators for options trades are the same as for day trading. However, I focus predominantly on the price envelope and slow momentum indicators. A fast momentum indicator is on the day trading chart.
Renko Chart Price Envelope Reverse
The price envelope shows where the swing changes directions. You are in a sell swing when you have red envelope dots on top. And when you have green envelope dots on the bottom, you are in a buy swing.
The dot shift from green to red or red to green is when a Renko options trade would begin. A slow momentum indicator line cross must confirm the dot shift.
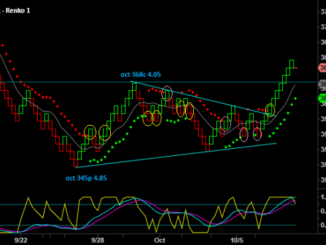
- Yellow circle: price envelope reverse buy.
- Synthetic options trade: buy a 365 call for 4.50 and sell a 360 put for 3.75.
I have only discussed the yellow circle in the Renko options trade review video. However, the pink circle is also a synthetic options trade that you would make. The pink circle is a swing addon trade.
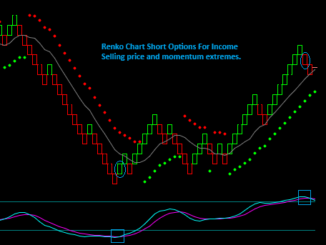
Renko Chart Slow Momentum Extreme
Besides confirming the Renko price envelope reverse direction, the slow momentum indicator shows price and momentum extremes. These extremes are important for timing Renko options trades as they often precede a swing reverse.
Seeing momentum extremes on ‘slower’ Renko charts is significant for selling options for income. We want an indication that the swing will typically reverse when selling longer-term options.
- Blue circle: price extreme reverse sell
- Sell a 390 call for 5.00.
- The swing high was 378, and this option strike is 12 points out of the money with 6 weeks to expiration.
- You can do this trade as a synthetic sell by selling the OTM income put and buying a weekly call option.
- Trading the Renko price extreme reverse with an option synthetic is a trade that I will discuss in a future trade review.
- This would be a similar trade as what is done when day trading.
Note: the text on the chart shows that there is also a 345 put sell at 5.30. This put sell is an open trade from a Renko price extreme reverse to the left of this chart.
Option Theoretical Value And Profit At Expiration
We will look at graphs for the Renko option trades that show theoretical value and profit at expiration.
A profit graph shows the combined position and the gain or loss for different strikes at expiration. It will also show the effect on the position if you add or close an option.
The theoretical value is useful for your option trade management:
- The theoretical value is a way to look at the price of an option you bought today in X days.
- If I don’t close an option trade today, what will the price be if the underlying goes up or down X points?
Renko Option Position Expiration Profit Graph
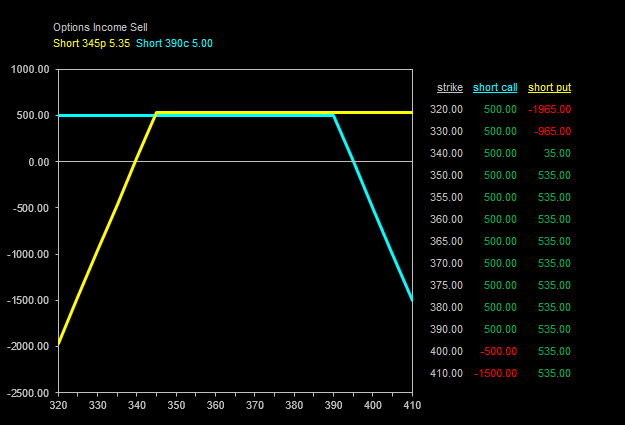
You are looking at a profit graph for the 2 Renko option income sells. The blue line is for the short 390 calls, and the yellow line is for the short 345 puts.
The combination position profit curvature is that of a short option strangle. A short option strangle has its maximum profit when expiration is at or between the 2 option strikes.
If you look at the graph and the columns to the right:
- Your maximum profit is in between the short strikes = 500 + 535
- A short option strangle can only lose on the put or call at expiration, but not both
- Your Renko options trade will lose money at expiration if the underlying is at one of the short strikes +/- 10.35 points
It is very important to understand that there is a difference between having a profitable trade and your short option expiration risk.
For instance, consider a QQQ expiration at 390. Your position will have a gain of 35.00, but you will be assigned the short 390 call. This assignment will make you short the QQQ at 390.
Renko Option Trade Theoretical Value
The next 2 option position profit graphs use the theoretical value calculation to view the profit on a future date and underlying price.
Short Call Option Profit Graph
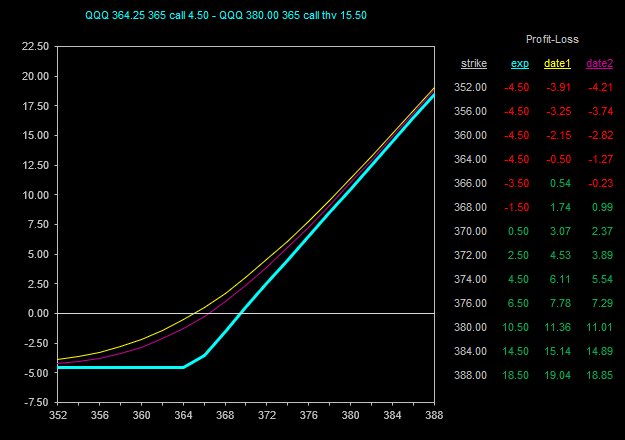
365 call buy at 4.50 when the QQQ is 364.25:
- Date1 is the trade date.
- Date2 is 5 trading days later; assume a QQQ price of 380.00.
- The theoretical value for the call is 15.50, so the option trade profit would be 11.01
You can also use this graph to view the profit if a price increase or decrease occurs on a future date.
- What if 380 is the opening price, and there was a sell-off to 376.00?
- Your profit of 11.01 would go down to 7.29.
And you could do whatifs to prepare for a potential upcoming trade.
- You have a slow momentum cross and a price envelope reverse green dot on the Renko chart.
- You will have a trade if the brick is completed.
- The last price is 347.50, and the brick will complete at 349.73, giving a buy.
- What will the synthetic option trade prices be for long the 350 call short the 346 put?
Short Put Option Profit Graph
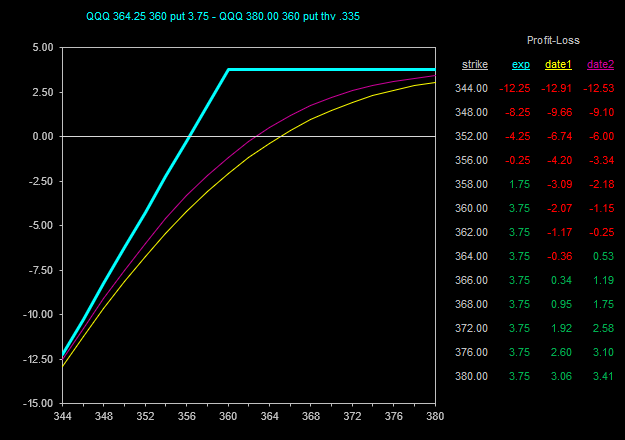
The profit graph for the short 360 put is used similarly to the long 365 call. You can view your Renko option trade price on a future date and QQQ price.
In the case of the short put sell [or a short call on a sell-off], you can also decide to close the trade.
360 put sell at 3.75 when the QQQ is 364.25:
- At QQQ 380.00, the theoretical value for the put is .335, and your profit would be 3.41.
- You could close the put and gain 91% of its potential profit.
- Additionally, you would free up the margin required for the short put.
Whether you would do this for a weekly option that has 2 days to expiration and is 20 points higher than the short put strike is one decision.
However, you could also use this exercise for a longer-term, short option. What if your Renko option trade has 6 weeks until expiration, and you have gained 95% of the potential profit? I would close the trade in that case.
Renko Option Trade Review Videos
The 3 Renko trade review videos [ links below] discuss this QQQ option position trading chart.
Video1 is a more in-depth review of the short 340 put and 390 call option income trades and the long 365 call-short 360 put synthetic option trade.
Video2 and video3 reviews the trades on the rest of the QQQ chart, especially focusing on:
- Option expirations and strikes to trade.
- Synthetic option trading for direction and option sells for income from price and momentum extremes.
- Managing a series of losing trades and the question – can the short option in a synthetic trade be held?
- Option position curvature and profit study.
- Closing income sells based on the percentage of profit gained and time to expiration.
- Exiting from a profitable short swing and going long.
Video1 Options Trade Review
Video2 Options Trade Review
Video3 Options Trade Review