Selecting the best Renko trading indicators will be one of your primary decisions. You will use the indicators for making your Renko trading strategies and trade decisions.
Any charting program that can make Renko charts will include dozens of potential indicators. But are these ‘canned’ indicators the best choice, or can they be customized specifically for your trading strategies?
How can you choose the best indicators for Renko trading?
Key Questions For Selecting Your Renko Trading Indicators
|
Using the right indicators can significantly enhance the effectiveness of trading Renko charts. But what are you going to base your indicator choices on?
My approach to selecting Renko trading indicators came as a day trader. I watched many Renko charts and brick sizes, focusing on the trading swings I wanted to be sure my indicators and setups would trade. It turned out that I developed the 3 indicators I would use for trading instead of trying to use the program’s indicators.
Ultimately, you want to be sure you are selecting the best Renko indicators for how you will trade.
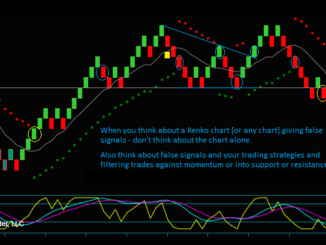
Renko Charts Aren’t Tradeable With All Indicators
Before choosing your Renko trading indicators, you must understand the differences between Renko charts and other chart types.
Understanding chart differences is necessary because there are indicators that won’t work for Renko trading. And this may include some of your favorite indicators you have previously used.
Renko charts are unique. The bricks on the chart are made from price only. Therefore, you cannot use indicators based on time or volume as Renko trading indicators.
Related to indicators are patterns. So, also realize that patterns used on other chart types may not work.
You cannot use candlestick pattern trading strategies. These won’t work when trading Renko charts because the chart bricks are the same size besides being price charts. Consequently, you will not see patterns in single bricks, despite having no set timeframe.
The candlestick is a single timeframe bar, and the sizes can vary. You see Candlestick patterns on individual bars. Therefore, traditional candlestick patterns like Doji, Hammer, Shooting Star, Bullish Engulfing, etc., do not apply to Renko charts.
Market profile also won’t work for Renko charts, nor will indicators like on balance volume. These are indicators and strategies based on volume; again, Renko bricks are price only and do not use volume.
What Charting Program Are You Using
Renko charts are available on many of the different charting programs. And all of these programs will have many indicators that you can try. Just be sure that you are using tick data; this is necessary to make the charts.
Regarding your Renko trading indicators, will the ‘canned’ indicators work for your trading style? Or do you want more control and customization?
For Renko charts, my favorite program is NinjaTrader. Besides being a good charting program, I especially like the programming language that is part of the program.
Using the NinjaTrader Editor, you can write your own Renko trading indicators. I also wanted Renko charts with price wicks besides the classic charts. The editor has a BarsTypes function that you can use for coding.
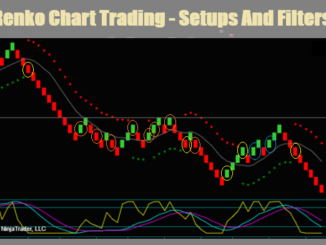
The chart below is a NinjaTrader Renko chart with price wick bricks. And on the chart are my 3 custom Renko day trading indicators.
The classic chart would look the same, except none of the bricks would have wicks. Remember that all prices will be seen in real time, regardless of chart type.
Also, remember, just because this chart has price wicks, these are not candlesticks. These are Renko bricks, and all the bodies on the chart are the same size.
What Is Your Trading Style
Your trading style would be a combination of whether you are a day trader or a position trader and your trading strategies. For instance, are you a day trader that only trades intraday or a position trader that holds trades for longer-term trends?
Consider using moving averages or the MACD indicator if your trading strategy is trend-following. However, if your strategy involves identifying overbought or oversold price swings, the RSI or Stochastic might be more suitable.
Additionally, what market conditions do you trade?
Some indicators perform better in trending markets, while others are more suited to range-bound markets. For instance, moving averages can be effective in trending markets but may give false signals in sideways markets. On the other hand, oscillators can be useful in identifying potential reversals in range-bound markets.
These indicators should be available in your charting programs and would work on Renko charts. But will these basic program indicators be good Renko trading indicators that will work with your trading method?
Adapting Your Renko Trading Indicators To Your Method
I use multiple indicators for day trading a Renko trading method vs. a system that trades signals from one indicator mechanically.
The indicator’s importance is to show price information from the charts that you can use for trade setups. Again, I am not trying to Renko trade indicator signals.
The indicators must be sensitive to the different market conditions and price swings on intraday Renko charts. I do not trade signals but trade setups. Each setup uses multiple indicators as components, depending upon the following:
- The initial chart price moves from long to short or short to long.
- Price continuation during a developing swing.
- Price extremes that lead to swing reverses.
- And I intend to avoid trading during market consolidation or into support and resistance prices.
I cannot get these indicators from those included in the charting program. Instead, I have customized and written Renko trading indicators for how I want to trade and the various setups used.
I know that perfect indicators do not exist, and I have not tried to find them. And I do not constantly try to optimize the indicators to work all the time.
For instance, price consolidation is essentially untradeable. I am not trying to select indicators for that market condition. I want indicators that typically work for the Renko chart reads and market conditions that have tradeable price movement.
With these objectives in mind, I have developed 3 customized indicators and 3 different trade setups. I found that the best Renko trading indicators are momentum-based for day trading Renko charts.
Article: The Best Renko Indicators Are Momentum
Video: What Is The Best Indicator For Renko Charts
Renko trading Indicators For The Day Trader
The Renko day trader may take numerous trades daily depending on how long a price swing continues or reverses. As such, momentum, its characteristics for leading price, and its sensitivity to price changes are factors in selecting it for my Renko trading indicators.
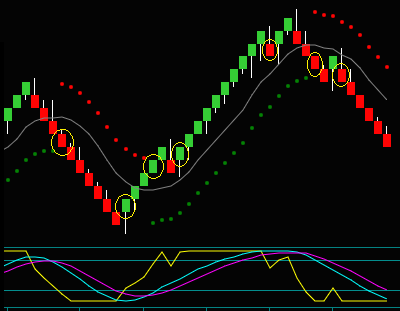
Using the chart above, I marked the trade setups during this period in yellow circles. The time spanned 3.5 hours, and you see 7 circles. This quantity of setups is a function of multiple price reverses in each direction and a period without consolidation.
This is a ‘textbook’ Renko chart for indicator trading – they should all be like this. I studied these kinds of Renko charts for selecting and developing my Renko trading indicators. It was necessary to ensure they were effective for trading periods like this.
Studying charts with your indicators is part of the backtesting processing, a process necessary for writing and customizing indicators. You want to know how they would work on historical data and for different market conditions.
If the indicators didn’t work for a chart like the one above, I would want to fine-tune them. As mentioned, I am not trying to make indicators that always work. But they do need to work for the best Renko trading charts.
The momentum Renko trading indicators and related trade setups caught the moves on the chart.
Renko Trading Indicators And Charts
Let’s look at the Renko trading indicators closer, why they were selected, how we use them for trading, and how I have customized them.
Price Envelope Indicator
The chart shows the price envelope and momentum indicator that came with the charting program. I have customized these 2 indicators and combined them into the outer bands of the price envelope.
The momentum calculation is changed using the difference between a fast and medium speed momentum indicator [instead of a single period like the program’s indicator].
Instead of seeing 2 separate indicators, the price envelope dots turn red when the momentum is negative and green when the momentum is positive.
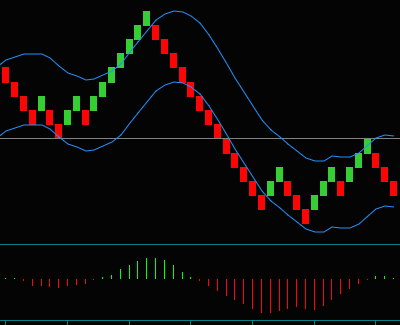
Slow Momentum Indicator
The slow momentum indicator was my first indicator, which I have used in all my day trading strategies before Renko charts.
You will see this indicator’s versatility and the information it provides in the Renko trading discussion below.
I developed the slow momentum indicator to resemble price movement. I wanted it to move to extremes when the price did. But I wanted it to be flat in the center of its range when the price moved sideways or consolidated.
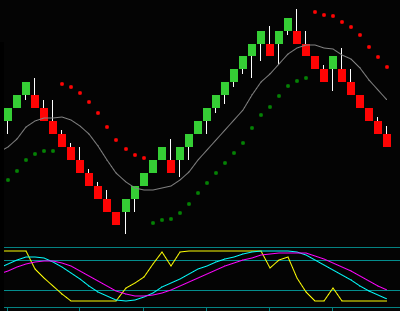
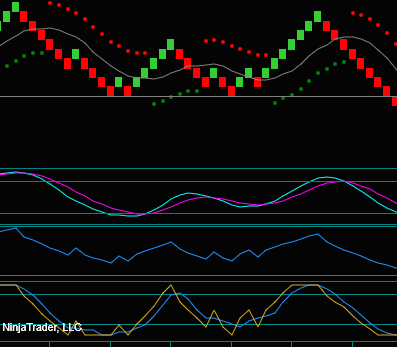
The chart shows the Renko slow momentum indicator with 2 other common charting program indicators, Stochastics and RSI.
Slow Momentum Compared To RSI And Stochastics
I want to point out some examples of why I didn’t like Stochastics or RSI for Renko day trading.
- RSI [middle indicator] intends to show an overbought or oversold price. For day trading, I use the term extreme.
- But compare the RSI indicator to our slow momentum indicator. Although RSI has high and low points, at no time does it reach its extreme lines.
- One of the uses for the slow momentum indicator is to go to extremes with the price. These extremes are components for a trade setup called the price extreme reverse – we could not use RSI for this trade setup.
- Stochastics [bottom indicator] is an oscillator like slow momentum, but there are 2 particulars I don’t like about this indicator.
- I do not like the indicator’s ‘sharp’ points at its extreme lines. You can see the yellow line cross the blue line multiple times before both lines stay above the extreme line.
- I much rather see the smoothing from our slow momentum indicator.
- Also, compare the 2 indicators when the price bounces from support and returns to a double bottom.
- Slow momentum moves to the middle of the range like the price retrace. But Stochastics moves from the lower extreme to the upper extreme. The move is bigger than the price would indicate.
- I do not like the indicator’s ‘sharp’ points at its extreme lines. You can see the yellow line cross the blue line multiple times before both lines stay above the extreme line.
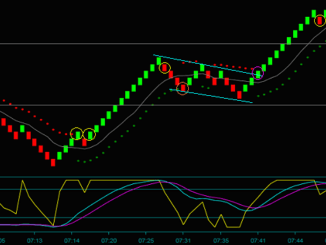
Fast Momentum Indicator
I have customized the Renko fast momentum indicator [yellow line] to move quickly from extreme to extreme. You can see this on the chart by comparing the indicator to the slow momentum indicator.
This indicator shows price continuation after a price retrace. You can see fast momentum leading the price back in the direction of the price envelope and slow momentum.
- Yellow circle price envelope reverse.
- Purple circle fast momentum continuation.
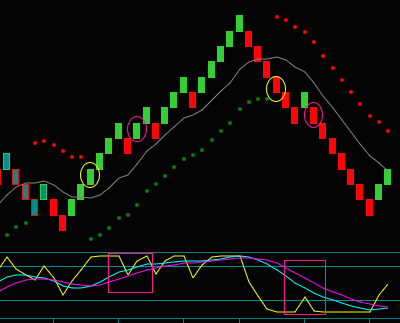
Looking at the purple rectangles, you can see how this Renko trading indicator shows momentum leading to price continuation.
- A counter brick following the price envelope reverse is the price retracement.
- Slow momentum continues moving in the direction of the price envelope, but fast momentum moves counter from an extreme.
- A directional brick follows the counter brick, and fast momentum moves to an extreme again.
This description is for our Renko momentum trading pattern called a fast momentum hook. It is a trade addon strategy since it shows price swing resumption and continuation.
And it is also another example of selecting multiple customized Renko indicators for trading instead of using single indicators that come with the charting program.
Selecting The Best Renko Trading Indicators
Choosing the right Renko trading indicators is pivotal in developing an effective trading strategy.
This process begins with understanding the unique characteristics of Renko charts and clearly defining your trading style and strategies. And then, you want to customize and adapt the indicators to meet your specific needs and objectives.
You will then want to test the effectiveness of your Renko trading indicators by studying them on many different charts and market conditions. Do these indicators work on the price moves and conditions you designed them for?
For instance, as a Renko day trader, I knew the period I wanted to trade, along with 3 types of price moves I wanted to capture. As described above, I developed the Renko trading indicators from momentum for these objectives for our trading strategies.