What are Renko chart strategies, and how would a trading strategy compare to an indicator signal?
Although traders may use trading strategies or signals, these are quite different from each other. Renko chart strategies are a comprehensive trading approach that combines indicators and patterns that make trade setups.
And these trading strategies even include conditions where you filter your setups and don’t take certain trades.
On the other hand, I think of signals [regardless of chart type] as mechanical trading – you get a signal, and you take the trade.
You may call Renko strategies more complicated than signals because they are more involved. But the combination of components can also make the trading strategies more accurate than signals.
|
Renko Chart Strategies Key Takeaways
|
Renko Chart Strategies Aren’t Signals
Our Renko chart strategies have been developed specifically for the uniqueness of this chart type. Unlike the more familiar candlestick bars, the Renko charts are made from price-only bricks. So, all strategies must work for charts that do not use time frames or volume.
We use 2 types of Renko chart strategies for trading: (1) a combination of indicators that make trade setups and (2) Renko breakout pattern setups.
The trading method also has Renko chart strategies for avoiding lower-odds trades. These are called trade setup filters.
For instance, consider a price breakout setup into a price momentum divergence. Or a W breakout setup against slow momentum flow. Those situations would be examples of setup filters.
Candlestick Chart Trading Signals
Now, look at the signals on the chart. In this case, you would use a MACD indicator for signals on a candlestick chart. You go long where the chart is marked B and short where the chart is marked S.
Compared to a Renko chart strategies setup, I see nothing on the chart that would tell me to take these trades besides the indicator crossing.
Additionally, if you take the trades when the candlesticks close, these signals look like they have a big lag. Indicator lag from single indicator signals could always be a problem.
Besides MACD, moving average crossovers might generate buy or sell signals. These signals characteristically lag price moves too.
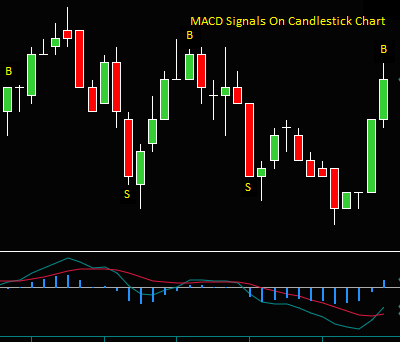
Another problem with mechanical indicator signals like these is that they continue to trigger in all market conditions. So, if the price goes into a consolidation range, MACD or moving averages will continue to give signals.
Renko charts could give the same problem during consolidation. But we have strategies for filtering or avoiding trading inside of consolidation.
Renko Trade Setup Filtering Strategy
Besides strategies for trade setups, we also have Renko chart strategies for avoiding trades because of certain market conditions. And I would say that strategies developed to avoid losses are as important as those for trade setups.
I think of the Renko indicators as setup components for trading strategies, not signals. A combination of our 3 Renko indicators are components for our 3 trade setups. Each indicator trade setup has at least 2 components.
If one of the setup components is missing at the time of the trade, you don’t do the trade. Again, this differentiates Renko chart strategies trading from single indicators as signals.
But not all setups are tradeable because of a Renko chart strategy called trade filtering. Trade filters keep setups from being traded in the following conditions:
- Trading directly into a support or resistance price
- Trading against momentum
- Trading inside of price consolidation
Yes, there are times when a trade filter can cause you to miss taking a winning trade. But the filtering strategy is developed to avoid more losing trades because of lower odds trading conditions.
Filtering is an example of selecting Renko indicators as components for trading method setups. Using multiple trade setup components is the difference between using Renko indicators in a trading method and trading indicator signals.
Especially important is that the Renko chart strategies for filtering trades are something you would not do when signal trading. That would be contrary to mechanical signals, where you take all trades regardless of conditions.
Renko Chart Trading Setups
We have 3 Renko chart indicator strategies; I discuss these indicators in greater length in the links below.
The Best Indicators For Renko Charts
Renko Chart Momentum Trading Indicators
The first chart shows two: (1) price envelope reverse and (2) price extreme reverse.
The second chart shows a third setup: (3) a fast momentum hook that is a strategy for trading price continuation inside a swing. This chart also shows trade setups you wouldn’t trade because of the Renko filtering strategy.
Also, along with indicator setups, we have a Renko strategy for trading pattern breakouts.
Renko Trade Setup Component Combinations
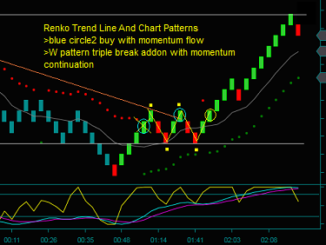
Renko Chart 1
Unlike a single indicator signal, the Renko charts show 3 different indicators that we combine into trading setups. Another strategy, a pattern setup for breakout or momentum reverses, is also seen.
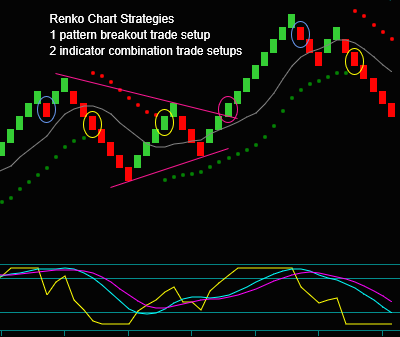
- Blue circles [2]: Price extreme reverse trade setups that include a slow momentum indicator extreme + a price extreme brick count.
- This Renko strategy would never be a MACD or moving average signal because they include a price extreme instead of a crossover signal.
- Yellow circles [3]: Price envelope reverse trade setups that include a price envelope dot shift + a slow momentum indicator extreme reverse.
- This Renko strategy uses momentum indicator customization to keep it from lagging the price, similar to the MACD indicator reverses on the candlestick chart.
- Purple circle [1]: Besides indicator combination trade setups, the Renko strategies also include pattern breakout trade setups.
- The purple lines show a triangle pattern; the purple circle is the breakout setup entry brick. Pattern breakout setups are not indicator trades; however, you would not trade them against momentum.
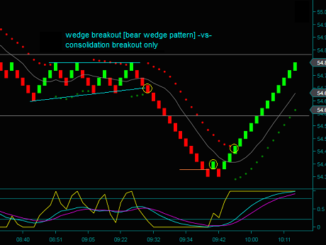
Renko Chart 2
You will recognize the price envelope reverse and the price extreme reverse trade setups from the chart above; I did not mark these on the chart.
This chart shows our 3rd indicator combination setup and Renko strategies for a pattern reverse setup and trade setup filtering.
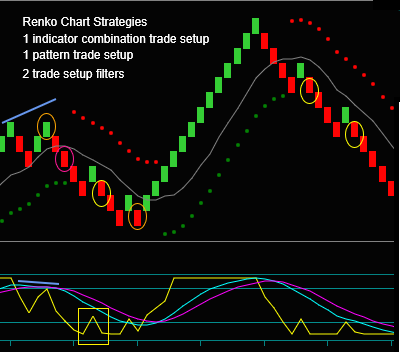
- Yellow circles [3]: Fast momentum hook [see the yellow box on the yellow indicator under the chart] + slow momentum continuing its direction on the counter bar before the yellow circle.
- This Renko chart strategy is for continuing price continuation after the price envelope reverse and is a setup for making addon trades.
- Purple circle [1]: This is another pattern trade setup strategy. The pattern is not a breakout but a reversal pattern called a price momentum divergence.
- Price made a higher high [or, in this case, hit the high as a swing double top] but momentum made a lower high + a slow momentum extreme cross.
- Like the price extreme reverse shown in chart1, this is another Renko strategy that MACD or moving averages will not signal.
- Orange circles [2]: Renko trade setup filters, in this case, 2 price continuation setups avoided.
- Avoid setup 1 because it was against momentum and would have been into a price momentum divergence.
- This filtering strategy led to the purple circle pattern setup sell discussed above.
- And avoid setup 2 because you would filter it for price. We do take trades that do not have 3+ bricks of room to a support or resistance price.
- Avoid setup 1 because it was against momentum and would have been into a price momentum divergence.
Renko Chart Strategies Vs. Indicator Signals
I have tried to explain the differences between strategies and indicator signals.
The focus is on our strategies for indicator and pattern setups, as seen on the Renko charts above, and when it would be prudent to avoid trading a setup.
These strategies and trading approaches would not occur with signals, where you would trade them mechanically. Or take advantage of the uniqueness of Renko price charts instead of time frames or volume.
I have never traded Renko indicator signals mechanically. Instead, there are greater benefits from Renko chart strategies. Trading a method that includes indicator and pattern setups, along with trading filters and consistent trade management, has exceeded the simplicity of signals.