
Renko charts offer a unique approach to trading, but there are important Renko trading questions to answer. This is especially the case before considering a change from traditional bar charts.
Begin with this question: How do Renko charts differ from traditional time-based charts like candlesticks or bar charts?
Traditional time-based charts, such as candlestick or bar charts, represent price movements within specific time intervals [daily, hourly, minute]. In contrast, Renko charts do not use time. Renko charts are price-only charts.
A price chart is one where a new Renko brick is added only when the price moves by the predetermined brick size, regardless of how long it takes. This means that while a candlestick chart will always have a new candle for each designated period, a Renko chart will not have any new bricks until the price has moved the amount of its setting.
Now, let’s discuss other key Renko questions.
Key Renko Trading Questions
There are several key things to understand about trading Renko charts. I am going to talk about the following Renko questions:
- What is a Renko Chart?
- What is a Renko brick?
- What is a Renko brick setting?
- What are the disadvantages of using Renko charts?
- Do Renko charts show all prices?
- What is a Renko classic chart?
- What is a Renko price wick chart?
- How do Renko charts differ between completed and realtime?
- What is the best brick setting for Renko charts?
- Is the brick setting and timeframe the same thing?
- Do you trade intraday or longer term?
- What is the best indicator for Renko trading?
What Is A Renko Chart?
What are Renko chart brick types, and how do they differ from bar and candlestick charts?
Answering what is a Renko chart also includes additional related Renko trading questions:
- How do you make Renko bricks?
- What is a Renko brick setting?
- Are all bricks the same size?
- Do Renko charts show all prices?
The key to answering this question is understanding that Renko charts are price charts.
The big difference between a bar chart and a Renko price chart is that it has no time frame. New Renko bricks are not made at set intervals like new bars [candlesticks].
Instead, Renko charts use brick settings that determine when you will get a new brick. On a price chart, you only get a new brick when the price moves the same amount as the specified setting.
For instance, if you are trading a 5-minute bar chart, you will get a new bar every 5 minutes. But if your Renko setting is 5, you will get a new brick once the price moves 5 ticks or points. Regardless of how much time this may take.
The Renko chart below has a setting of 5, the size of every brick. You can see time below the chart, but this is the time of day and not a specific time frame.
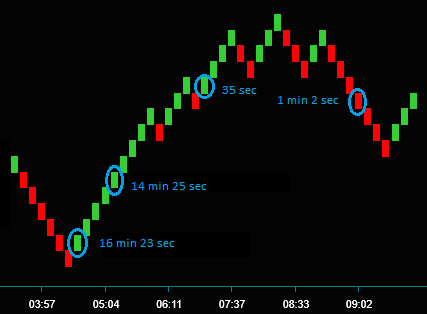
I have circled some of the bricks on the chart and marked how long they took to make. You can see a wide range from a 16min 23sec brick to one that only took 35sec.
Are There Disadvantages To Trading Renko Charts?
Renko charts have numerous supposed disadvantages. I can’t agree with all of these; let’s discuss whether Renko charts filter out some prices further.
Consider: Although Renko charts filter out market ‘noise’, they do this by filtering out smaller price moves.
- Do Renko charts miss some price moves?
- Can you ‘fix’ this problem by adjusting the brick size?
Renko charts may have a loss of price information. This is because the filtering of price moves smaller than the brick setting.
For instance, consider a brick setting of 5.
- You could have a price move of 9 ticks, and you would not see 4.
- Those 4 ticks would only be seen if the move had been 1 more tick and another brick was completed.
Would a change in the brick size be a solution to the problem? No, this would not work. Regardless of brick size, the potential of a price move smaller than the brick setting would always exist.
But do Renko charts miss some of the prices? Read the section below, where this is discussed further. You want to understand the differences between completed and realtime charts especially.
Key Renko Question: Do Renko Charts Show All Prices?
One of the more frequent Renko trading questions is discussed as a Renko chart trading disadvantage. Some people say that the Renko charts leave some prices off. And thus, the charts don’t include all prices.
But is this correct? Do Renko charts miss showing some prices? Consider some related Renko questions:
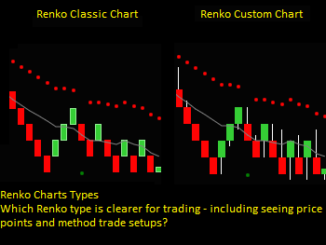
- What is the difference between a Renko classic chart and one with price wicks?
- How does a Renko chart show complete and realtime bricks differently?
A Renko classic chart [chart above] shows that completed bricks are all the size of the brick setting. And for this reason, the classic chart appears as if it’s missing prices. For instance, if the last brick is up but was down before completion, none of the down prices show.
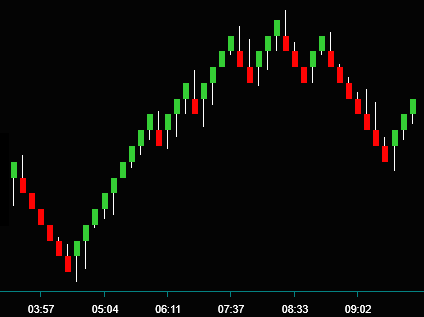
The chart below is a Renko chart with price wicks. The bodies of the bricks are all the same as the classic chart, but you also see additional prices. Look at a down brick and see a wick showing up prices. Look at an up brick and see down prices before completion.
Renko Chart Bricks Realtime
But the answer to the missing prices question is more than whether you are trading with a classic Renko chart or a price wick chart. The key to understanding whether renko chart bricks are missing prices comes from the differences between a completed and a realtime chart.
Look at the last Renko brick on each chart below; the setting is 3. These are realtime Renko bricks. This is why these bricks are different than the rest of the chart.
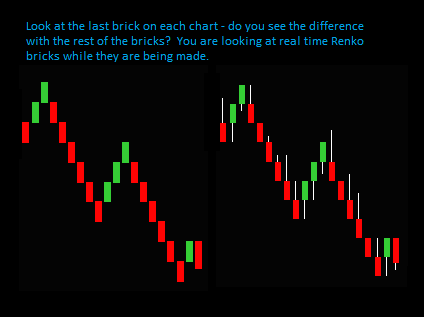
The last red classic brick chart may look too big, but understand what you see. The previous brick closed green, and this is where the red brick opened. To close as a red brick, the price must move 3 ticks lower than the green brick. This is realtime Renko chart price action; the brick is not too big.
The Renko price wick chart looks different, too. Again, the brick looks too big, and the price wick is below the brick.
Like the classic chart, this is the price action for a realtime brick; the brick is not too big. The wick is now below the brick because the body shows the open and last price, and the wick shows the prices below the last price.
So, the answer to the Renko trading question asking whether Renko charts show all prices is yes.
What Is The Best Brick Setting For Renko Charts?
Another one of your Renko trading questions will be what is the best brick setting to use for your charts. Additional questions and considerations:
- What is a Renko brick setting?
- Can a timeframe be a brick setting?
- Are you a position trader or a day trader?
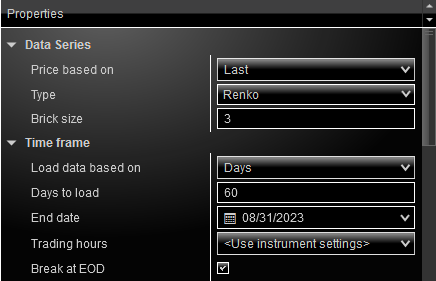
Your Renko brick setting is a fixed amount value that determines the size of each brick. For instance, look at the properties box below under data series, and you will see the parameter for brick size = 3. This means that every brick on the chart will be 3 ticks or points in size.
Key Renko Question: Do Renko Charts Have A Timeframe?
Have you ever asked what timeframe is best for Renko charts? Maybe you didn’t understand that Renko charts were price charts and didn’t use time.
So, if you did ask this Renko trading question, I would expect your answer to be an explanation that Renko bricks do not use a timeframe. The brick settings are the number of ticks or points needed to make a new brick.
However, do a web search for a question about the best Renko timeframe. You will get the following as a bold snippet:
- “Renko charts can be used on any time frame, but the most common time frames are 5 minutes, 15 minutes, and 30 minutes. Use multiple time frames to confirm your trades.”
This is unfortunate and confusing because Renko removes the time factor for charting. You cannot make a Renko chart using time. You make new bricks based on price movement.
Looking at the property box for making a Renko chart, the only parameter to add is for brick size, which in this case was 3. There are properties for the timeframe, but as you can see, this is for how many days of data you want added to the chart.
But what if there was also a parameter for the time frame? What would it tell you?
If the time frame were 30 minutes, the chart would show how many 3 tick or point bricks there were for each 30 minutes. I cannot see how knowing this would be useful.
Do You Position Trade Or Day Trade?
We have answered any questions or confusion about Renko bricks and their chart settings. Your setting will not be a timeframe but a setting corresponding to the number of ticks or points you want for the size of each brick on your Renko chart. Do note this setting would be the same for the classic chart or the price wick chart, as the bodies on the completed charts are the same size.
To answer the Renko trading question about the best brick setting, you must decide whether to use the Renko charts for position trading or day trading.
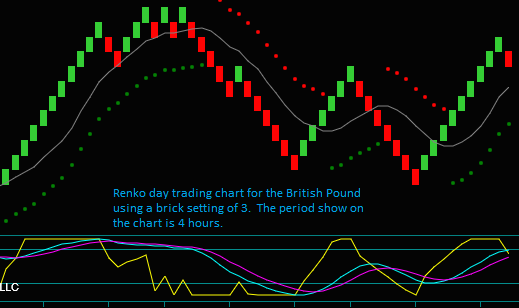
Day traders would tend to use smaller brick settings like 3-5. The chart below is my Renko day trading chart for the British Pound future and has a setting of 3 ticks.
This Renko chart shows 4 hours, giving numerous trade setups. This is consistent with day trading.
In contrast, position traders would use a larger brick setting, where the longer the term, the larger the size. When position trading the SPY with a brick setting of 15, I typically get 2-5 bricks per day, which for August gave 6 different trading swings.
What Is The Best Indicator For Renko Trading?
This Renko trading question differs from many of the other questions. They were more about Renko trading basics and how Renko charts work.
To begin with, you have to decide how you are going to Renko trade:
- Are you going to trade a Renko indicator as a mechanical signal?
- Will you trade a combination of Renko indicators as trading strategies and a method?
I do not think that there is a single Renko indicator that can be used for mechanical signals. So, in that context, there is no best indicator.
But when using indicators for Renko strategies in a trading method, my experiences are that the best Renko indicators are momentum indicators. Here are some reasons for this Renko question answer:
- Renko charts focus on price movement, and there is a direct relationship between momentum and price.
- Momentum indicators work best with price, not time or volume, which Renko charts do not use.
- Momentum can lead the price and show the strength or weakness of the current price direction.
- Momentum can also show extremes and divergences that become price reversals.
- You can combine and customize for different Renko chart conditions.
When you ask about the best indicator for Renko trading, you ask an extensive question about your core Renko method and how you will trade. Much of this website has been developed to answer this question specifically.
This including:
- Renko chart strategies and indicators
- The best indicators for Renko Charts
- Renko chart momentum indicators
You can also click the link to watch the video: What Is The Best Indicator For Renko Charts
Renko Charts And Trading Questions
Renko charts can be beneficial for trading, especially as they are price charts that can effectively use momentum indicators.
But Renko charts and their differences from traditional bar charts come with questions. Understanding the answers to these questions is necessary for trading Renko charts.
This article is intended to address many of the key Renko trading questions for learning to trade with Renko charts.
Hello
You write here
https://renkocharttrading.com/renko-trading-questions/
That renko bar does not depend on time.
The brick is the number of ticks or points needed to make a new brick.
If so, why in the setting of 100 ticks per brick will the chart look different in a different time frame?
A daily Renko chart does not look like a 4-hour chart with the same setting of 100 ticks per brick.
Why is it like that?
Time in a Renko brick is how long does it take for the Renko brick setting to be met – and remember ticks means price movement and not volume or how many trades there were. Your example of 100 ticks, meaning a price move up or down by that much, will continually take a different amount of time. You may get a 100 tick move in 10 minutes or it might take 20 minutes [or whatever] – so even though you will see a time scale below the chart, it is the time it takes for the brick setting and not a time frame where you will continue to get a new brick. For instance, consider a 5 minute chart – you will get a new bar every 5 minutes.
You also mention a daily Renko chart. There actually isn’t such a thing, again it depends on the brick setting. If your setting is high enough, you won’t even get a new brick every day. But if your setting is low enough, you will get multiple bricks every day. The same thing would occur in a 4-hour amount of time – you wouldn’t actually have a 4-hour Renko chart.