What Are Renko Chart Bricks?
The Renko chart bricks replace the bars or candlesticks on time frame charts. There are 2 types of Renko bricks: the classic brick and the bricks with price wicks.
- Classic bricks only show the opening and closing prices when they are completed.
- Price wick bricks show these same prices but also show prices above a down brick and below an up brick.
These Renko chart bricks are referred to as price bricks. This makes them very different for trading than traditional bar charts. Those chart types plot prices based on a timeframe, like some number of minutes. Additionally, they can also show the volume for these timeframes.
Renko charts ignore time and volume. I find the price-only characteristic of the Renko chart bricks an advantage of using Renko charts for trading.
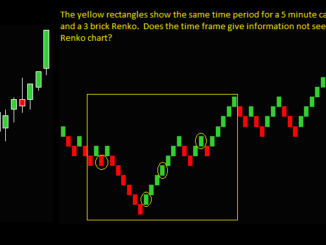
How Renko Chart Bricks And Time Frame Candlesticks Differ
Look at the Renko chart bricks compared to a 5-minute candlestick chart. The price movement of the bricks is clearer and does a better job of answering the following questions:
- Has the price continued its direction?
- Has the price direction reversed?
- Has the price gone into consolidation?
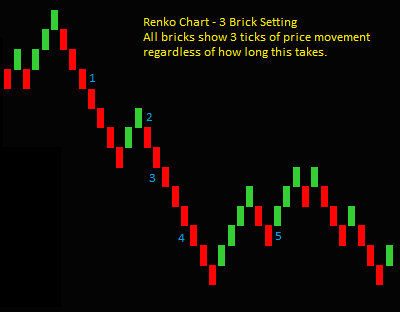
As you can see on the charts, Renko bricks use a fixed amount of price movement to be formed. So, every brick on the chart is the same size. For instance, if the setting is 3, each brick will have 3 ticks of price movement.
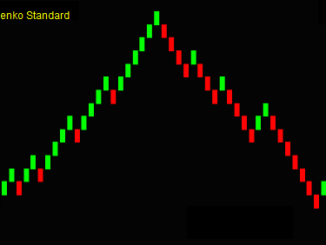
Renko Classic Bricks
As mentioned, there are different Renko brick types. The Renko classic charts only show the completed bricks, while price wick charts show additional prices besides the completed brick. I will discuss these differences below, but let’s look at a classic chart for now.
You will only see a new Renko brick when the price moves the setting size, regardless of how long this takes. The chart below shows classic bricks. But it does not matter what type you use on your charts. Both Renko brick types are completed in the same amount of time.
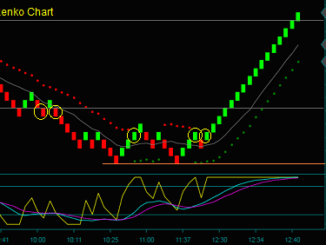
I marked 5 chart bricks below to show the wide range of time it can take to form a new brick.
- 1 – 7 seconds
- 2 – 23 seconds
- 3 – 2 minutes 44 seconds
- 4 – 20 minutes 30 seconds
- 5 – 4 minutes 20 seconds
You see a range of 7 seconds to over 20 minutes, one of the longest brick times I have seen. Interestingly, this brick was made in a continued downswing vs. a sideways move where you would expect slower bricks.
Renko Price Wick Bricks
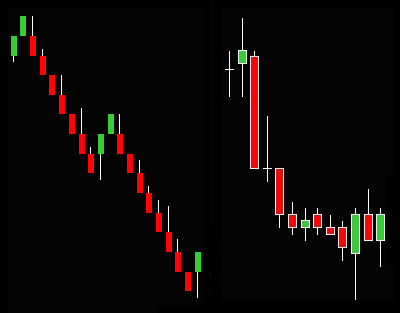
You are now comparing the Renko price wick bricks to candlesticks. Do they look similar to you? They are very different.
Yes, both the bricks and bars have a price wick. But the candlestick chart wicks can be above and below the body – all prices in the timeframe are shown.
On the other hand, the Renko chart brick can only have a wick below an up brick or above a down brick. This is because every new brick closes at the high or low, so there are no prices [wicks] above or below these closes.
Key things to understand about the Renko chart bricks:
- Each brick type takes the same price movement to complete, not the same amount of time.
- There are no prices missed in real time for the classic bricks. You can see the prices that become wicks while the brick is completed. This is important to understand for trading.
- The price wick bricks show additional prices on the completed brick in realtime. But again, you can see these same prices on the classic chart before completion.
I will watch both Renko chart types while trading, but my main focus is the classic chart. It is a clearer chart, and sometimes the price wicks can be distracting. This situation may differ if prices were missed while trading, but this isn’t true.
How Long Do Renko Bricks Take To Form
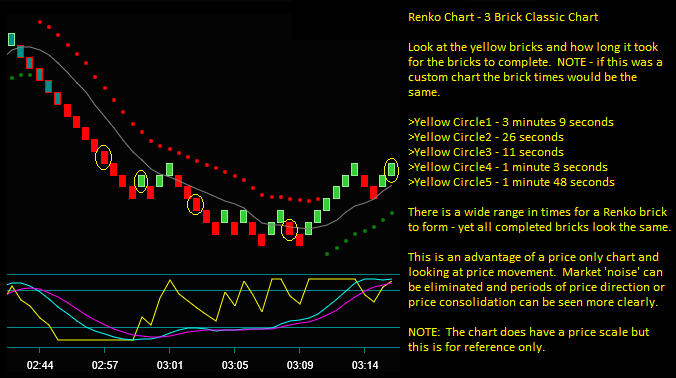
You saw the Renko classic chart above with a series of bricks marked with their times to form. See the yellow circles on the chart and the outline to the right.
There are more Renko charts below; these are 3 brick charts. This means that the price size setting of each Renko brick is 3 ticks. Note that the Renko classic bricks and price wick bricks will have the same setting size and closed body size.
Specifically:
- Each completed brick is the same size.
- This is a classic Renko chart, but the completed brick bodies are the same size, even with a price wick.
- Each completed brick is 45 degrees up or down from the previous brick.
- Note the 2nd chart below: You can see the last 2 bricks for each chart type. These are bricks that are still forming and not completed bricks.
- A new green brick will form 3 ticks above the previous brick’s high.
- A new red brick will form 3 ticks below the previous brick’s low.
As noted, there are differences between Renko classic and price wick charts. However, the time for a Renko brick to complete is not one of them.
The major difference is with chart types. You know what price a Renko brick will close, but not how long it will take. On the other hand, you know when a time frame bar will close but have no idea at what price.
Renko Chart Brick Differences
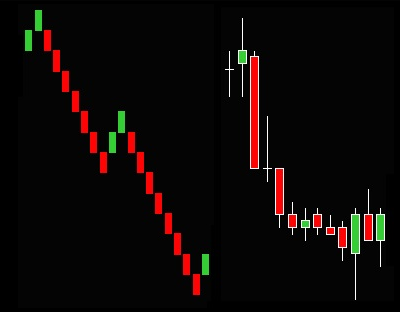
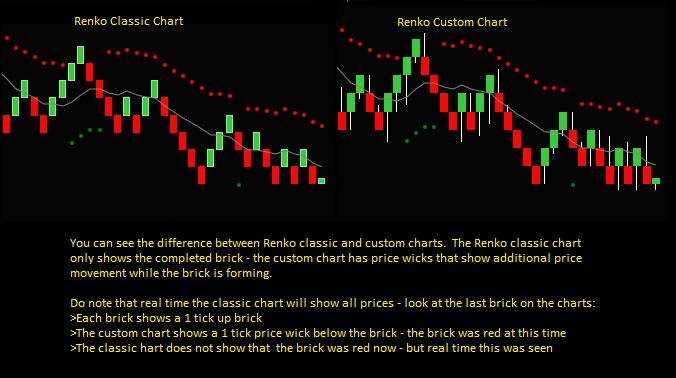
To review, there are 2 types of Renko chart bricks: (1) Classic and (2) price wicks. The Renko classic chart only shows the completed brick. In comparison, the Renko price wick charts show additional prices. They show high prices above a completed down brick and low prices above a completed down brick.
But these differences are for the completed charts. This is very important to understand for Renko chart trading. Both Renko brick types show all price movement in realtime.
Look at the last Renko bricks on the 2 charts below:
- Classic chart – the last brick is 1 tick green. There is now no indication that the brick was ever red. But in realtime, you would have seen a red brick.
- Price wick [custom] chart – the last brick is 1 tick green. But the price wick shows that the price had been red for 1 tick.
This is important to note: The main chart type differences are for the completed charts. In realtime, you would see all Renko brick price movement. This is an important characteristic for learning to read Renko charts; you see all prices when trading.
Questions:
- Which Renko chart type would be clearer for trading?
- Does either chart show a sell setup at the last red brick?
Selecting Renko Indicators For The Chart Types
Renko Strategies And Trading
An advantage of trading with Renko chart bricks is more clarity in viewing price movement. In that context, the classic charts might appear to be the cleaner charts.
However, those differences are for completed classic Renko bricks and charts. While a Renko brick forms, you see the price movement on both charts.
For trading, I wouldn’t trade a Renko brick chart alone, regardless of the chart type. As discussed in the video, trading strategies include Renko trading indicators and trade setups. The related trading strategy and not the chart type answers the question: Is there a Renko setup on the last red brick of the chart?