A Renko fast market refers to a vast increase in speed at which the Renko bricks form on the chart.
Whatever the case for a fast market, the result is excessive price movement and changes with increased volatility. Bids and ask prices can change rapidly, and their spreads can widen.
For Renko charts, market price movement happens so fast that numerous new Renko bricks would show the same timestamp. These bricks will seem to be forming simultaneously on the chart.
Renko charts are price charts where new bricks form based on a setting size, not a timeframe. As a result, you do not know how often the Renko chart will show new bricks. It could take a few seconds or minutes for new bricks to form.
The Renko fast market speed is untradeable and best avoided.
Fast Market Volatility Compared To Fast Price Movement
Let’s differentiate this Renko fast market from quick price movement that may occur from a breakout or a price reverse after hitting resistance or support.
For instance, consider realtime Renko charts after completing one brick and starting another one. Sometimes, the new brick completes so quickly that you will see both bricks almost together.
This is a general price movement and not a fast market. For instance, consider that, as the brick completes, a trader buys at the offer, and someone buys an immediate change a tick higher as well.
But there are also plenty of times when the new brick takes multiple minutes to complete, and the next tick is up or down in the opposite direction.
Fast Market Trading
The effect of trading a Renko fast market chart is magnified. This is because the chart would show numerous bricks printed all at the same time. Each different Renko brick would be higher or lower by the amount of its setting. However, traders would miss the price movement as it was happening.
You would have an untradeable situation, and depending on how fast the market is, you could see a relatively large span of points or ticks but not the bricks form individually.
I will show you a Renko fast market chart and bricks below. You will see around 15 bricks printed concurrently, with a setting of 3 ticks. It’s certainly very unusual, but it could happen.
The discussion will continually return to this point – traders cannot trade a Renko fast market chart or fast markets in general.
Key Renko Fast Market Trading Questions
There are important questions and implications about fast markets and their impact on Renko day trading.
- Because of the problem with multiple Renko bricks during a fast market, does this eliminate using Renko charts for day trading?
- Do the Renko fast market charts often go against the direction of an open trade?
- Would a timeframe candlestick chart be better than a Renko chart?
- If you are going to trade Renko charts, when can you start trading again after the fast market bricks form?
So, are Renko bricks too fast to trade, or are there better trading chart alternatives?
How Fast Are Renko Bricks?
We will keep drawing the distinctions between a Renko fast market chart and a more typical chart. We will also examine the speed at which the Renko bricks form.
I made a video for the charts below. You will see key points for the realtime bricks from the last red brick on the left side chart to the last green brick on the right side chart.
The video is only 53 seconds [note there is no volume], but consider some of the actual times:
- The amount of time from the opening of the red brick [left] to the closing of the green brick [right] is 14 minutes and 9 seconds.
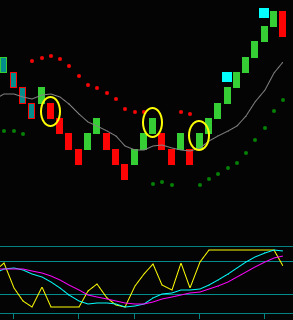
- The green brick where the price envelope dots shifted from red to green [yellow circle] took 6 minutes and 8 seconds to complete.
Video: Forming Renko Realtime Bricks
Renko Realtime Brick Speeds
Continuing with the Renko trading swing starting at the yellow circle3 buy:
- The time from the green brick-yellow circle3 to the last green brick is 51 minutes and 50 seconds.
- The fastest brick on the chart was 1 minute and 7 seconds.
- The slowest brick on the chart was 14 minutes and 17 seconds.
- The last brick on the chart is a Renko realtime brick lasting 8 minutes and 16 seconds.
- If it goes lower by 1 more tick, it will complete as a red brick. Or it could still complete as a green brick by going 3 ticks higher than the previous green brick high.
In the Renko realtime video, you saw the transition from a completed brick to the opening of the next brick. One brick opened flat. And one brick opened, went up a tick, and then back down a tick.
If these were Renko trade entry bricks, you could have executed a stop at the completed brick with a limit of 1 tick.
These certainly are not Renko charts in a fast market. Nor were these specific charts too fast to trade.
Fast Market Candlestick Chart
Let’s first consider using candlestick time frame charts for day trading because of potential fast markets.
The thing you must keep in mind is the main difference between Renko charts and candlestick charts.
A Renko chart is a price chart, meaning you get a new brick each time the price moves the setting amount. In contrast, a candlestick chart is different than a Renko chart. It is a timeframe chart. You will get a new candlestick based on the time setting; in this case, the candlestick time is 5 minutes.
Compare this chart candlestick chart to the Renko chart below. Do note that the last 2 candlesticks are the same period as the Renko bricks between the first and last vertical lines.
Is there a better alternative than the Renko chart during fast market price moves? If there is, it isn’t a candlestick timeframe chart. But I will continue to contend that fast markets aren’t tradeable.
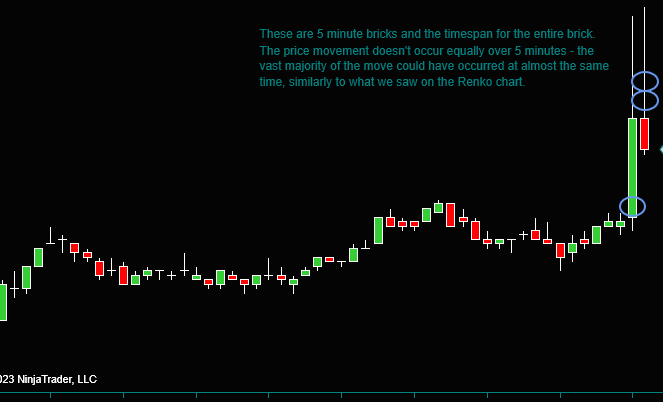
These candlesticks are 5 minutes; the period for the Renko bricks was little more than a minute. The candlestick chart during a fast market is not better than the Renko fast market chart.
The candlesticks distribute price movement unequally across their timeframe. Like what we observed on the Renko chart, most of the move could have occurred almost simultaneously.
Although you would only see 1 candlestick, you would also see fast movement up and down. You can see that from the size of the real bodies [distance between open and close] and the size of the wick spikes.
Look at the 3 purple circles syncing with the Renko chart purple circle1 and the 2 yellow circles. Trading the candlestick chart was not possible, not even in hindsight.
Renko Bricks During A Fast Market
Look at the Renko day trading chart below. If you can look closely, you see paint bars on the left side of the chart and the right side of the chart [left of first vertical line-right of last vertical line] with all green and red bricks in between.
These are essentially all 7:30 Renko bricks [.5 seconds maximum difference]. And this would mean that many [most] of these bricks are printed at the same time.
This is a classic example of a Renko fast market chart related to a news release at this time. Talk about spanning multiple ticks during a fast market; the first green brick upswing shows 3 tick bricks, and there are 15 of them.
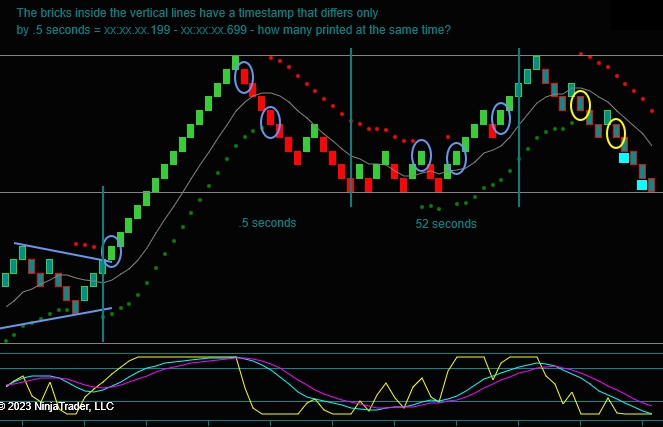
Can you imagine seeing a fast market move of 45 ticks intraday [not from a gap opening] at maybe the same time while trading?
Also, look at the section on the Renko chart between the 2nd and 3rd vertical lines. Although this section spanned 52 seconds, you likely would see multiple bricks printed. This is because some of the brick speeds were 1-3 seconds.
You would not have enough time to evaluate and execute potential Renko trade setups at those brick speeds. That is regardless of the bricks forming individually.
Do Renko Fast Market Bricks Go Against Your Trade
Fast markets that are random occur less frequently, and you know the news release times to avoid. For instance, I wouldn’t trade index futures when the FOMC results are released.
A fast market could still happen unexpectedly when you are in a trade. However, what typically happens? Do these Renko fast market bricks go against or with your trade?
I won’t say never, but I don’t remember being in an open trade where a fast market similar to the discussed chart went against it. However, it certainly could.
But there are times when they have gone in the direction of an open trade.
This is a function of not taking trades into important new releases. Also, I think because the Renko trading strategies in our method tend to be into momentum reverses or breakouts that expand and increase volatility.
And no, I am not saying that we have developed a trading method that benefits from being in trades before a Renko fast market. If traders didn’t avoid certain news releases, I am sure that fast markets would frequently go against the trades.
Sometimes, these breakouts lead to bigger directional moves [not fast markets] and sometimes increased price movement and volatility that does become a fast market.
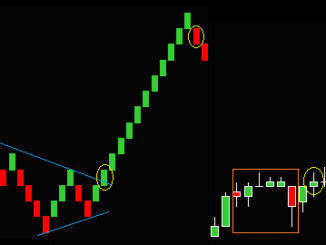
Renko Fast Market Trading Examples
On the chart above, purple circle1 was a Renko triangle breakout setup.
- When triangles form, both price and momentum slow down. This expands on the breakout along with volatility.
- You don’t trade the purple circle for reasons discussed in the video about this chart. But if it had been tradeable, it would have been ahead of the fast market.
Now, look at the chart below.
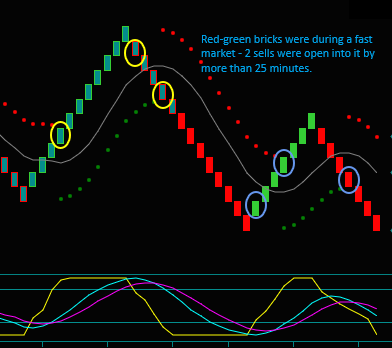
- Then, on the second chart, the red and green bricks are Renko fast market bricks.
- Price and momentum reversed from extremes at yellow circle2 and positive to negative at yellow circle3.
- The yellow circle1 short occurred 63 minutes before the fast market, and the yellow circle2 short happened 26 minutes before.
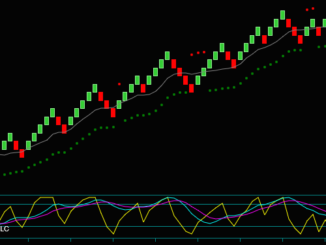
Does the yellow circle1 buy seem like Renko fast market bricks followed it?
It wasn’t; this is a directional trade after the momentum reversed. The time from the circle to the swing high lasted 24 minutes; the fastest brick formed in 1 minute and 2 seconds, and the slowest brick in 6 minutes and 5 seconds.
Renko Fast Market Chart Video
Watch the video [link below] to hear a discussion of a Renko fast market chart and brick speeds. The video will focus on these points:
- Were any trades available ahead of or during the fast market?
- When can you trade again after the fast market seems over and Renko brick speed has ‘normalized’?
- Renko chart study.
When Can You Start Trading Again?
This is a very important consideration. After a Renko fast market, when can you start trading again? You don’t want to return to trading until you feel the causes and increased volatility are ‘in the market’.
I can’t answer when to trade with a set amount of time. Like, don’t start trading again for 1,2,3… minutes. There is more to the decision than that. You will read your Renko charts for this.
Has the brick speed stopped forming multiple bricks together, and has it become more typical? You will look for a decrease in volatility and sharp price moves, possibly in both directions.
These are examples of what I mean by that fast market getting ‘into the market’.
Again, don’t rush back in; accept that you will likely miss some trades that could be profitable by waiting. This is okay and far better than taking trades too soon that you can’t stay with or manage according to your method strategies.
The Renko chart in the video shows no trades until the first yellow circle. But why? Because this looks like a great trading chart with multiple trade setups that would have been profitable.
This is a Renko fast market chart; you couldn’t execute the trades. Renko bricks forming virtually at the same time are untradeable.
Video: Renko Fast Market Chart