Understand how reading Renko charts can enhance your day trading analysis and increase effectiveness.
Renko charts are unique as price charts and provide a distinct structure that tends to make them clearer to read and evaluate. This is an important characteristic when developing your day trading strategies and setups.
But why can reading Renko charts be difficult? Aren’t all charts essentially the same?
No. The characteristics that add clarity to the Renko charts also take learning time. For instance, the Renko bricks develop in different amounts of time, and the completed charts differ from realtime charts.
But once you understand these, you can find them clearer to read than the bars on a time frame chart. And as a result, using the Renko charts for day trading will also be clearer.
What Is Renko Chart Reading?
I frequently refer to the term ‘Renko chart reading’. This is in contrast to trading by using fundamentals, where chart reading would refer to technical analysis.
Using a chart to interpret price movements, patterns, continuation, or reversal when making trading decisions would all be examples of components in Renko chart reading.
All the Renko bricks on the chart are the same size. In light of this, a cited advantage of Renko charts is that they help to filter out ‘market noise’ and focus on significant price moves, i.e., your brick setting.
This tends to be a more visual approach to chart reading and developing trading strategies. This is also something that I like a lot about Renko charts.
In the context of reading Renko charts, you actively understand the formations and patterns of the Renko bricks that represent price movement.
Besides reading Renko charts for price movement and patterns, we read the charts for key price points.
Renko Chart Trading Prices
Any chart would show you a daily high and low or a swing high and low. But we use Renko chart reading in our day trading strategies for finding support and resistance prices.
We are looking for swing double tops, bottoms, and what we call shift lines. A Renko shift line is a price that was both a support and resistance price.
Click the link below to watch a video discussing reading a Renko chart for key trading prices. Especially note the price action across the chart at the relevant prices and how we could see these on the Renko chart.
Video: Renko Chart Reading For Key Trading Prices
The Renko charts and their additional clarity are especially useful for chart reading for resistance and support prices that we do not want to day trade directly into.
Do You Understand Renko Charts?
To read Renko charts, you must understand their differences from other chart types that traders frequently use.
The key characteristic of a Renko chart to understand is that it is a price chart. This means you get a new brick [bar] only after the price moves a specified setting.
Thus, you know where a new Renko brick will be completed, but you don’t know when. Note that the Renko bricks can sometimes appear quite quickly. But don’t confuse Renko brick speed with Renko fast market charts.
This differs from a timeframe chart that gives you a new bar based on the time setting. It also differs from a tick chart that gives you a new bar based on the tick volume setting.
Renko charts use price only. Renko charts do not use time or volume.
Are Timeframe Charts Clear For Day Trading?
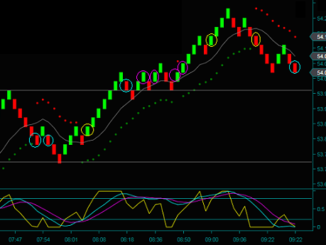
Let’s compare a timeframe [5-minute] bar chart to a Renko [3 ] chart to show how reading a Renko chart is beneficial.
Note that both of these charts are settings for day trading. We will discuss using Renko charts for day trading in greater detail.
When you compare the two charts, you can see how Renko charts filter out ‘market noise’ and bring additional clarity to trading.
Look at the orange boxes on the bar chart and then compare the yellow circles on both charts. The first thing to notice is how many fewer Renko chart bricks occurred during the time shown for the bar chart.
- The orange boxes are a good explanation for why this happened. You see 25-30 minute periods with only 1-2 bricks.
- Or look at the bar chart high to yellow circle2, a 40-minute [8 bars] period that only had 5 Renko bricks.
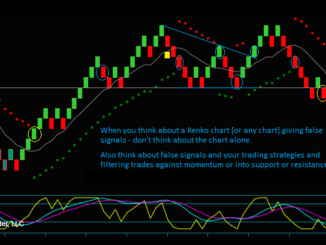
Looking further at the bar chart, especially the orange boxes or areas like them, how can you read any price action or patterns?
I wouldn’t try to day trade a chart with no further information [indicator strategies] than the bars or bricks. But I can’t visualize how anyone could have traded either of the two yellow circles when reading the bar charts.
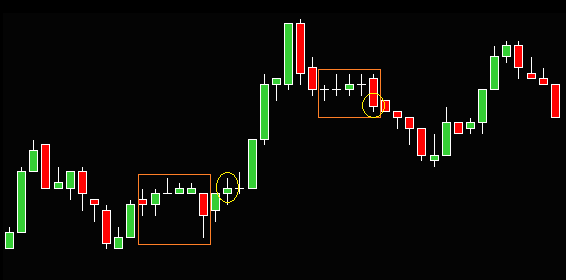
The blue lines on the Renko chart show a triangle breakout, one of my favorite trading patterns. This pattern and yellow circle1 coincide with the orange box and yellow circle1 on the bar chart.
This pattern is an example of how to read Renko charts for pattern setups. And one of my Renko day trading strategies allows for trading without indicators.
Again, I can not read any trade setup in the same area on the bar chart.
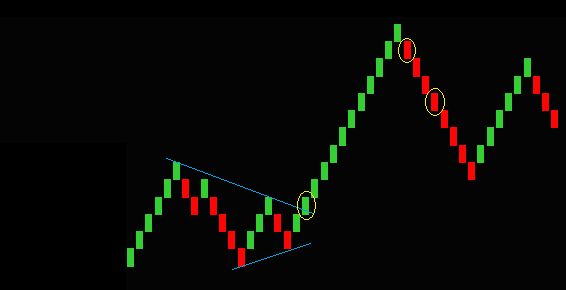
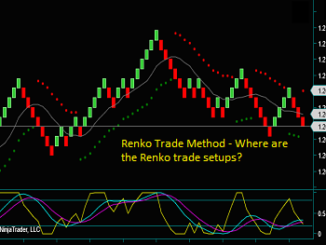
Trade Setups That You Couldn’t See On A Bar Chart
Renko chart yellow circle2-3 are trading strategies that also needed the indicators to confirm the entry bar. But I can understand which of the Renko day trading setups occurred.
On the other hand, I cannot read why there would be a trade on the bar chart. It looks like a consolidation breakout, but why did it occur on that bar? And, you have no consolidation that you would have to chart read on the Renko chart.
That area on the bar chart where there is a reversal from the high is a large bar, almost as big as the previous reversal bar. That becomes an issue with how much price movement a single bar may contain.
Chart reading a chart with that much potential price action in a bar is additionally difficult. Would a 1-minute chart be a solution? Think of those orange box consolidation areas on the 5-minute chart. You will probably notice more instances followed by breakouts, resulting in more missed trades you cannot see on the chart.
After only one reversal brick, you could enter a Renko day trade at the yellow circle2. Once you understood your trade setup strategy, nothing hid or remained unreadable on the Renko chart.
Learning To Read Renko Charts
As mentioned, searching for Renko chart advantages will discuss how the filter minor price moves. However, if you search for Renko chart disadvantages, you will see that filtering these prices makes you miss price points on the chart.
So, what is the answer, and does it affect how to read Renko charts?
Here are the 2 biggest issues for understanding and how to read Renko charts:
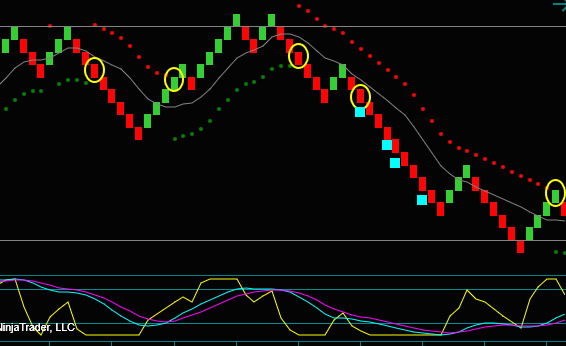
- Completed Renko charts are different than realtime Renko charts.
- Renko classic charts do not show the minor prices [prices smaller than the brick setting], but Renko charts with price wicks show the prices above a down brick or below an up brick.
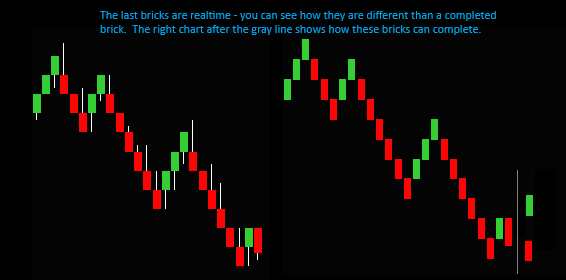
When looking at a completed classic Renko chart [right chart], you are looking at historical data. Each brick signifies a confirmed price movement for the brick setting.
So yes, the completed classic chart will not show prices smaller than the brick setting size. Regardless, Renko chart day traders can effectively use the completed charts for analyzing and studying their trading strategies.
Renko charts with price wicks [left chart] show some missed prices. You will see all prices above a completed down brick and below a completed up brick.
Reading Renko Realtime Charts
Looking at the last Renko bricks on both charts, you can see they look different from the other bricks.
Realtime Renko bricks show price movement as soon as they complete the previous brick. This is why you can see the price below a down brick. You are looking at the realtime price action of a brick while it is forming.
This is an important feature of reading the Renko chart in realtime. You may not know how long a brick will take to complete, but you know at what price it will complete.
For instance, look at the classic chart and the potential bricks to the right of the horizontal line. This is where an up brick or down brick would complete.
If you analyze your Renko day trading strategies and see that you will have a buy or a sell if the brick completes, you can enter a resting trade. You cannot achieve this with a bar chart within its time frame, or at least not as effectively.