Can you use Renko charts for day trading? Yes. And especially compared to trading time frame charts.
Using Renko charts for day trading is unique because the bricks are made from price changes only, not time or volume. This aids in seeing price action and changes that might not be seen in a time frame bar. Additionally, day trading with Renko indicators based on momentum provides setups that can capture price action and breakout moves.
Differences in using Renko charting occur for day trading and position trading. This especially includes trade setup frequency. For example, you would take more trades over smaller price swings and exit your trade when day trading. This would be in contrast to holding a trade for multiple days, looking for the biggest price moves during that time.
When considering your charts for Renko day trading, you would focus on the brick size. This is because day trading uses ‘faster’ charts than position trading. So, your chart settings would be smaller brick sizes so that you would have more trade setups.
Another advantage of Renko chart day trading is eliminating the risk of holding trades overnight or during periods when you are not trading.
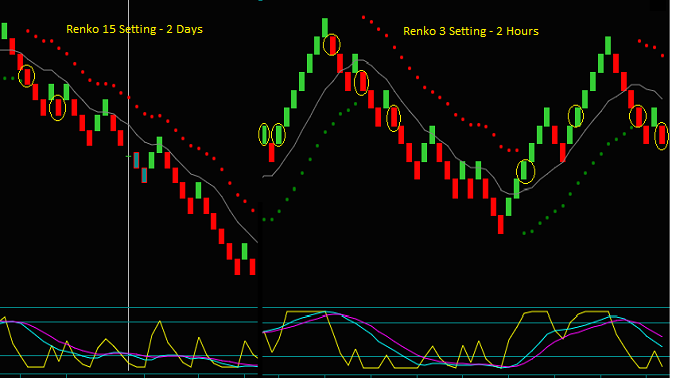
Look at the chart below.
- Left chart: position trading with a brick setting size of 15. There are 2 trade setups in 2 days.
- Right chart: day trading with a brick setting size of 3. There are 9 trade setups in 2.5 hours.
Best Renko Chart Settings
Renko chart brick settings have implications for using them for trading. And this is regardless of whether you are day trading or position trading.
The Renko trading charts use bricks calculated from price movement only. There is no consideration for time or volume. For instance, a brick setting 3 would mean that each brick contains 3 ticks of price movement.
- An up brick would be 3 ticks higher than the previous brick high.
- A down brick would be 3 ticks lower than the previous brick low.
Something else to understand is the differences between making bricks and a completed chart; this is very important for Renko trading:
- The completed chart can have prices that are missing.
- However, in real time all chart prices are there.
When day trading, what are your best Renko chart settings?
For day trading, the setting could be 3-5 tick bricks. While at the same time, position trading may use brick settings of 15-20 ticks and more. Do note some trade-offs for your best chart setting based on the following:
- Are you day trading, or are you position trading
- What contract are you trading
If the bricks are too fast, you cannot trade them. A Renko brick setting of 3 for the British Pound has been okay. I don’t trade the Emini S&P. However, I couldn’t imagine trading it with a Renko 3 setting; it would be too fast.
But if the bricks are too slow, you will not have enough trade setups, regardless of what you are trading. So again, you want more day trade setups with fewer position trade setups. The smaller brick settings will do this, thus the difference in brick settings. There is a clear example of this in the trading charts above.
Use Renko Charts For Day Trading But Trade A Method
How you use Renko charts for day trading depends on your trading method. I would not trade the charts alone. Instead of charts only, I see a Renko method as having setups that combine indicators with momentum and price patterns. And for our method, we also use trade filters to avoid certain setups.
It is these trading strategies that help avoid Renko charts false signals.
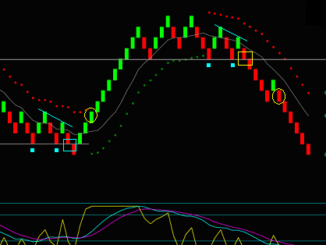
You can see the Renko day trading setups marked on the chart. Additionally, you see the trading indicators and price lines for resistance and support.
For our Renko trading strategies, all indicators and trade setups use momentum. I have found that momentum is the best Renko indicator.
The chart has a brick setting of 3 for the British Pound future. Where would you enter trades if you were day trading this chart instead of a method? My answer – I have no idea. But as a trading method with defined setups, I would know where the setups occur and when they were tradeable.
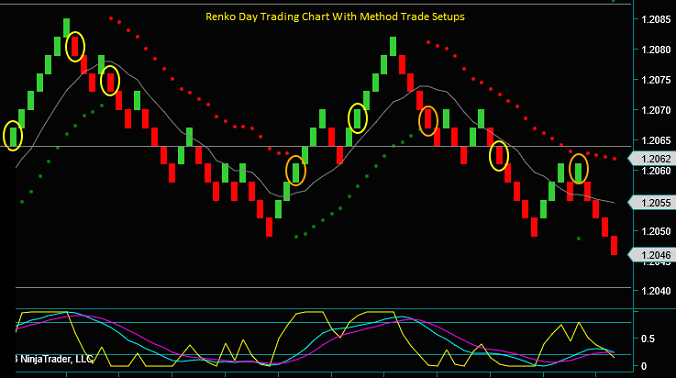
Renko Day Trading Method Trade Setups
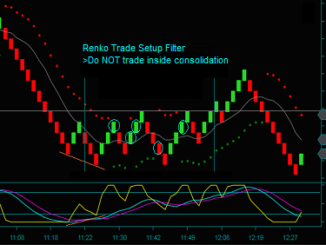
The yellow circles on the chart are ‘base’ Renko method trade setups; they are tradeable. These trade setups are combinations of customized Renko indicators.
The orange circles are the setup types, but they are not tradeable. What is the difference? Trades must have 3+ bricks of room to a support or resistance price.
One benefit of using a smaller Renko brick setting for day trading; you get more trade setup opportunities. The basis for using trade filters is avoiding more losing than missing winning trades. And that is the typical case. But there will be missing winning trades, so I want additional setups in the same swing.
Look at the 3 orange circles:
- The first 2 orange circles are 1 brick from the price. The following yellow circles are tradeable.
- The yellow circles move 4+ bricks of price and are profitable in the Renko method.
- The 3rd orange circle is also 1 brick from the price. Price does not continue, avoiding a losing trade.
We have been discussing using Renko charts for day trading. The following webpage discusses this in greater depth. There are also trading method videos to watch.
Learning To Trade With Renko Charts