Renko Trade Setups Entries
Renko chart trading is unlike trading other chart types. And these differences affect entering your Renko trade setups.
Renko charts use price bricks, which form based on price movement. For instance, if trading Renko charts with a brick setting of 3, there is a completed brick after the price moves 3 ticks. Of course, you don’t know how long this will take. Compare this to other chart types:
- Time charts give a new bar after a set amount of time.
- Tick charts give a new bar after a set amount of trade volume.
However, what does this tell you about price movement? And what does this tell you about the Renko trade setups entry?
What do you learn about price during the time or volume bar? For example, consider a chart with a timeframe of 5 minutes. The bar could trade back and forth at the bid and ask and be 2 ticks high. Or the bar could be many ticks [or points] high. A tick chart could be similar, and all the volume be for a couple of price ticks or numerous price ticks.
With Renko charts, you know where the next bar will complete. And this is an advantage of our Renko chart strategies; you know the size of each brick.
You don’t know need to know how much time or volume is inside the brick; it is irrelevant for these trading charts. What is important is that you know the price of a new Renko brick. And knowing this is a benefit for entering Renko trade setups.
The Renko Bricks Price Action
Yes, you know what price a Renko chart brick will complete. But what you don’t know:
- How much time will it take for the Renko brick to form? Price may be consistent, but time is not.
- And especially, the time for each new tick can be different.
- Consider a Renko brick that is 3 ticks and takes 90 seconds to complete. The first 2 ticks may take 85 seconds, but the last tick may take only 5 seconds.
- As discussed, how fast a Renko brick completes can make them seem so fast.
But the price action of these uncompleted bricks is meaningful in Renko chart trading. This price action is essential for seeing and entering the Renko trade setups more timely. This is especially the case when a Renko brick can complete so quickly.
Consider the following Renko chart trading questions.
- How do you see price action in a forming brick?
- How does price action affect brick speed?
- How does price action affect entering Renko trade setups?
Renko Chart Trading Price Action For Custom And Classic Charts
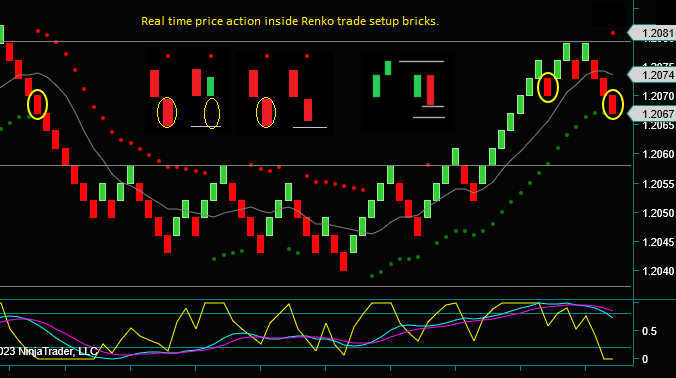
Look at the 2 charts below:
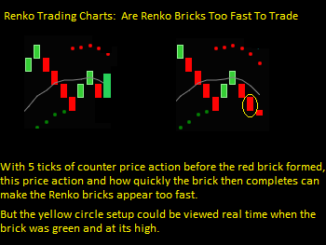
- Chart 1 is a Renko custom chart showing price wicks. Each price wick indicates additional price action. Some price action can be counter to the direction of the closing brick.
- For instance, look at the 2nd yellow circle, which closed as a red brick but shows a wick above the previous brick high. Before this brick closed, there was price action for an up or green brick.
- Chart 2 is a Renko classic chart. This chart type has no price wicks, but you still see price action in real time while the brick forms.
- This is important to note: the Renko bricks can look very different in real time than a completed brick.
- Again look at the 2nd yellow circle. You see a completed red brick, but it was also green for 2 ticks. The completed brick first had 8 ticks of price action.
You see price action on a classic chart for completed bricks. While trading, either Renko chart type will show all price action. Do note that price action does not necessarily affect brick speed. It would make sense that more price action would indicate longer brick time. But that may not be the case, especially not how quickly the brick completes.
Renko Trade Setups Entry Video
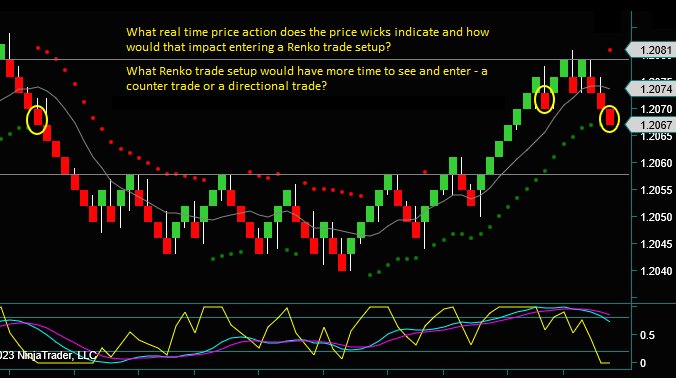
Renko brick price action does affect entering the Renko trade setups. The more price action and bigger price wicks give more time to see the trade setup and place a trade entry.
- When yellow circle 2 was 2 ticks green, you could see the trade setup components for a price extreme reverse. The chart showed 5+ consecutive green bricks after the last trade setup. And both of the slow momentum lines were above the upper extreme.
- Place a trade entry where a red brick would complete. Then cancel the trade if the brick does not complete.
Watch the video for a further discussion on Renko chart trading price action and the Renko trade setups entry.