
Trading with Renko charts asks the question: Are Renko bricks too fast to trade, regardless of how clear the completed chart may look? To answer this, consider the following:
- You do not make Renko trading chart bricks using a time frame.
- This is because Renko bricks form differently on a chart than a tick volume bar or time bar.
Renko trading charts use price movement instead of time or volume to form bricks. When the price moves a preset brick size amount, there will be a new Renko brick. For example, the charts below are 3Renko; this means a new brick forms when:
- The price moves three ticks higher than the close for an up brick
- The price moves three ticks lower than the close for a down brick
Each 3Renko brick forms at a different rate depending on how fast the price moves and sometimes are too fast to trade. But this does not mean Renko bricks are too fast to trade.
How Are Renko Trading Chart Bricks Formed
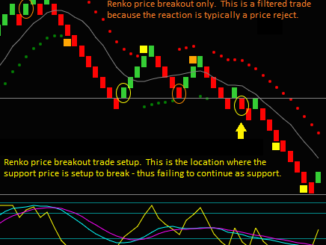
Renko trading charts eliminate price movements less the completed brick size. This can filter out ‘chart noise’ and clarify the price direction and continuation.
However, price movement on an unformed brick affects trading. Understanding how Renko charts form in real time will show why the bricks can appear so fast.
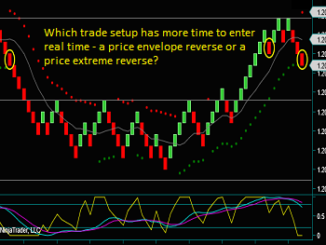
3Renko Trading Chart
The yellow circle on the completed chart is a method trade setup. The brick formed in 128 seconds, and no ‘fast brick’ issue with the trade. But this is not what the unformed brick looked like in real-time while trading.
The price action when the brick completes can have the most significant impact on Renko chart trading.
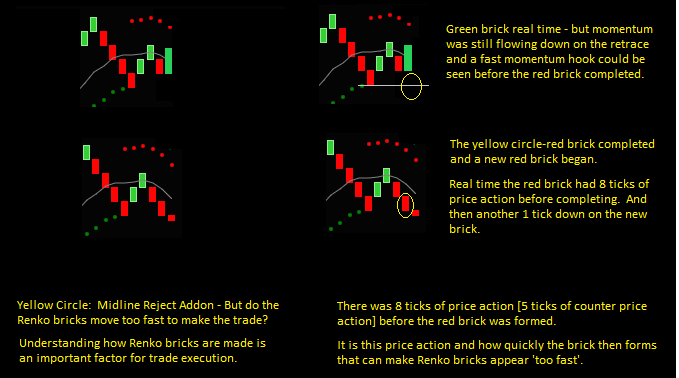
- Completed Renko charts do not have side-by-side bricks. This is not the case for an unformed brick moving counter to the previously closed brick.
- Understand the price action for the uncompleted brick. For example, the red brick took 2 minutes to form:
- The red brick began going up as a green brick and was 5 ticks higher than the previous brick close.
- If the brick had gone 1 tick higher, it would have completed as a green brick.
- Instead, the price went down 3 ticks below the previous brick closed and completed as a red brick.
- A new brick began 1 tick lower after the red brick.
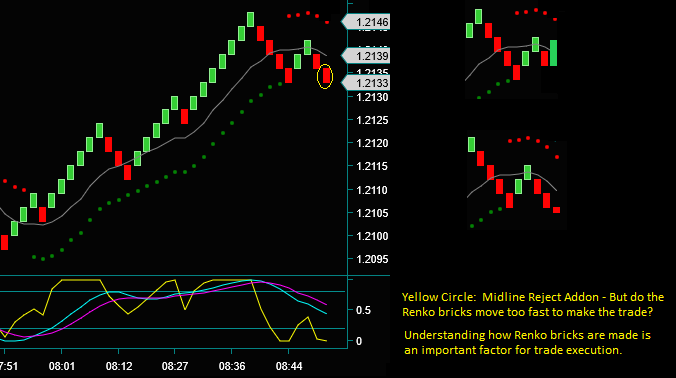
But when do you see the yellow circle Renko chart trade setup – when the red brick completes or at the real-time green brick high?
When Does The Renko Trading Chart Show The Trade Setup
Renko trading charts are unique when comparing a completed brick to real-time price action. But the Renko trading method setup components are seen before the brick is formed.
- Renko chart [above] yellow circle.
- The Renko trade setup components can be seen when the completed brick is green and 1 tick from becoming a completed green brick.
- Slow momentum flows down while the red Renko brick retraces like a green brick.
- A fast momentum hook is showing resumption.
- No price momentum divergences.
Place the Renko sell at the gray line, with the setup components, while the brick is green. The trade will be entered if the Renko brick forms a red brick. And if this is completed as a green brick, delete the trade entry.
All trading chart types can be too fast at times to trade. However, Renko charts are unique when comparing a completed brick to its real-time price action. And it’s this Renko trading chart price action that can increase how fast the Renko brick appears.
Be the first to comment