Trading With Renko Charts
Have you ever traded with Renko trading charts? Those charts with the red and green blocks going up and down at 45-degree angles?
The blocks are called Renko bricks and are used to chart price movement. These bricks can be any size, but they will all be the same on the chart. This is a big difference with time or tick charts.
For example, consider a 3 Renko brick chart. A new brick will form when the price moves 3 ticks above the previous high or below the previous low.
The Renko trading charts filter out smaller price movements outside the brick size. Again, this differs from bar charts that use a time frame or tick volume. There is no set time for a brick to complete. They may all be different regardless that the brick size is the same. Trading volume is not a consideration. These characteristics help you see the direction of the price more clearly.
How Do Renko Bricks Move
Bricks will never be next to each other. Using the 3 Renko example and an up brick completed at 100:
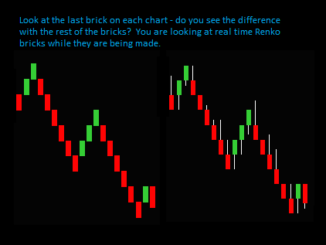
- A price move to 103 will make a new up brick. A price move to 102 will show a partial brick in real time but not a completed brick on the chart.
- You know that a completed up brick at 100 had a low price of 97. So therefore, if the price goes from 100 to 97, there will not be a new brick.
- Again, bricks are never next to each other. So, you would only see a partial brick in real time.
- A price move from 100 to 94 will give a completed brick, and it will be a down brick.
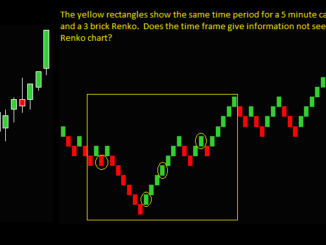
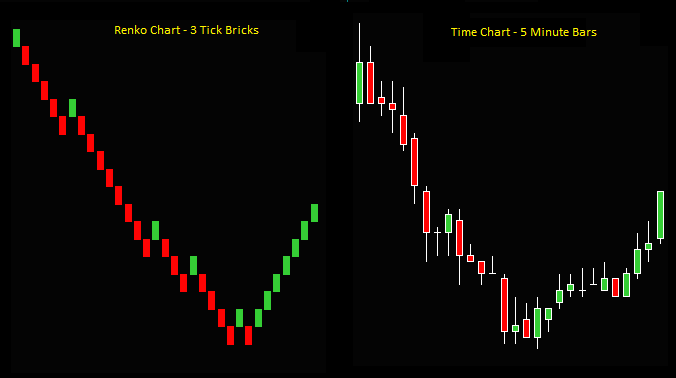
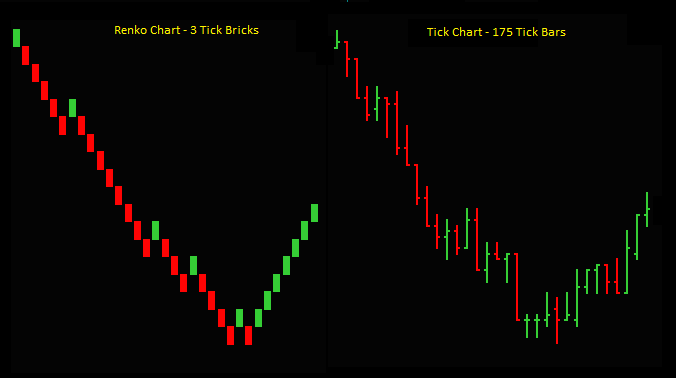
Compare the Renko trading chart to the time chart and tick chart below; which chart appears more tradeable?
I had never used timeframe charts for day trading but had traded with tick charts. It was tick charts that the Renko charts and trading method replaced.
Renko Trading Charts Disadvantages
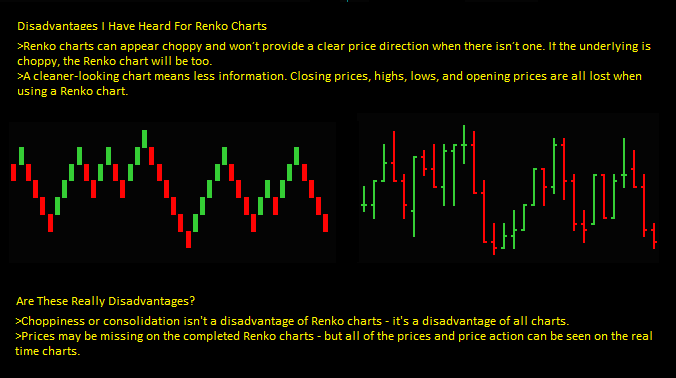
I have heard that the following are disadvantages for Renko charts:
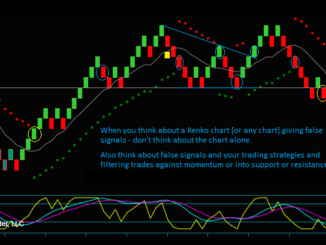
- First, the charts can appear choppy and not give a clear price direction when there isn’t one.
- The charts provide less price information. You will lose the closing prices, highs, lows, and opens.
But are these disadvantages?
I would call that a disadvantage if Renko charts appeared choppy when other chart types didn’t. But that isn’t the case; all charts appear choppy when the price direction isn’t clear. And this is an advantage to see on the charts. Our Renko trading method avoids trading inside of price consolidation.
Do Renko trading charts provide less information than other chart types? This may happen for the completed charts. However, you will see all prices and price action in realtime.
You can see primary differences between Renko charts and tick volume charts.
- Renko chart bricks are all at 45-degree angles, while many tick bars overlap.
- Renko bricks show price changes only, helping to make trading direction clearer.
- Renko bricks are all the same size, whereas the tick bars can be any size.
- Renko bricks filter out small price moves to remove ‘noise’ from the chart.
An issue with Renko trading charts is not knowing when a brick will be complete. This depends on the time for the price to move the brick setting. However, you don’t know the time in trading tick charts either.
However:
- You know the price where a brick will complete.
- You can see realtime price action on the Renko chart.
- And you know the price to enter a trade setup.
Trading Method Differences
I asked if you have traded with Renko charts. And if so, you have found characteristics that can make them clearer than other chart types. However, a better question is whether you have traded a Renko trading chart method.
Renko chart trading replaced tick chart trading because your trading successes will depend on your trading method.
Using tick charts for years, the Renko chart trading method started with the same basic concepts and trade setups. For example, the tick chart method had the price reverse and the price continuation addon trade setups. However, I could see and define these better on the Renko charts.
The trading method was still based on chart reading for price and momentum continuation. However, the additional visual clarity from the Renko charts made the method trade setups easier to see. I was also able to add a new trade setup to the method.
Trading prices remained important for the new method, as did chart momentum. The Renko indicators and trading strategies are based on momentum. I think that momentum makes the best Renko indicators.
The method had a concept called trade filters.
- Do not enter trades into price resistance or support.
- Do not enter trades when momentum is counter to direction.
- Do not enter trades when the price is divergent to momentum.
Trading A Method With Renko Charts
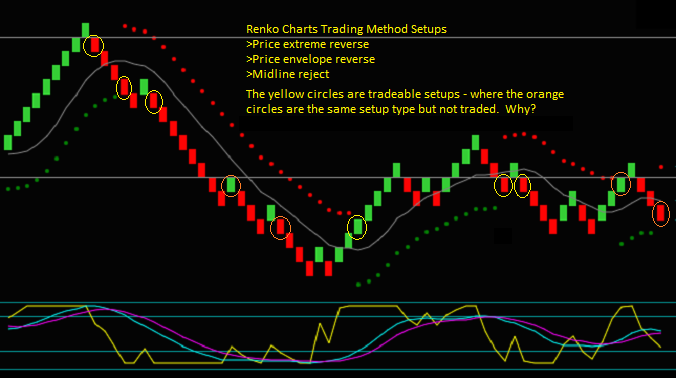
The Renko chart method was an extension of the tick chart method. The biggest difference was additional chart clarity for similar trade setups. Both trading methods included trade setup filters. Also, the Renko method did include a new setup for trading price and momentum extremes.
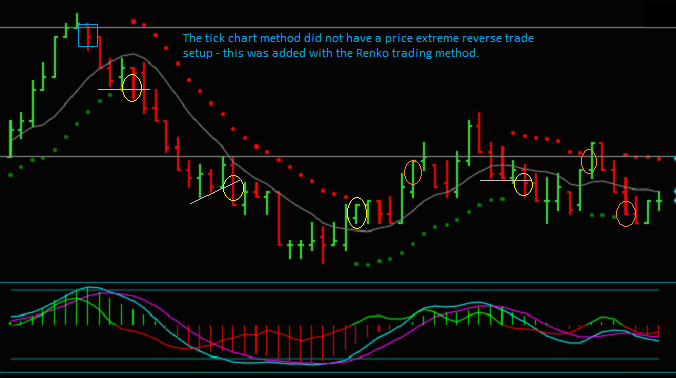
I will continue with a trading video about the trading methods and the 2 charts below, especially:
- Switching from tick charts to Renko charts
- Similarities and differences between the trading methods
- Trading method indicator changes
- The trade setups [box and circles] on the charts
Video: Have You Traded With Renko Charts
Renko Chart Position Trading
The above charts focus on day trading, but the Renko charts can also be used for position trading. We have Renko options trading strategies for the SPY.
The same Renko indicators and trade setups are used, but the Renko charts have a larger brick setting. The reason for this would be to accommodate position trading by getting fewer trade setups and holding for longer-term trades.
Using Renko charts for trading can be very flexible and done in multiple ways.