Are Renko charts false signals because of the chart type, or are these supposed signals misunderstood?
This is an important Renko trading question. Do you understand Renko charts?
Renko charts are price charts that focus solely on price changes instead of time or volume. Although price-only, without time or volume, can be a strong trading tool, it is a tool that needs to be understood.
Especially if the price movement is in a choppy or sideways market. And when this is the case, does a Renko false signal occur because price movements are not big enough to make new bricks?
A common critique is that Renko charts can give false signals when the brick size does not consistently exceed its setting. Additionally, because Renko charts use a fixed brick size, the charts are said to miss price movement that does not make a new brick.
But are these supposedly false signals and any resulting losses due to the Renko price chart, or are they due to the trader’s strategies and how they interpret the charts? This consideration is important for learning to trade Renko charts.
Understanding Renko Charts
Before discussing this idea of Renko charts false signals, it is important to understand the construction of a price chart – what is a Renko chart?
In contrast to traditional time-based or volume-based charts, Renko charts use a ‘brick’ system. A new brick forms when the price moves a predetermined amount called the brick size. Renko charts can filter out what some traders call ‘noise’ by focusing solely on price movement and disregarding time.
So, what in one case is called a Renko chart strength, is also called a Renko chart weakness.
What Renko Brick Size Is Used
The trader determines the brick size – they can use any size they want. Choosing a setting for a Renko brick is no different than choosing a time frame for a bar chart or a tick count for a tick chart.
The setting size is a function of the trading strategies used. For instance, Renko day traders will use smaller brick sizes than position traders.
If you are trading with a brick setting 3, all the bricks on a completed classic Renko chart will show 3 ticks of price. If trading with Renko charts with price wicks, you will see minor price fluctuations smaller than the setting.
However, it is important to note that completed Renko charts and real time price action differ. The charts show all price action before a completed brick. There is no price movement missed.
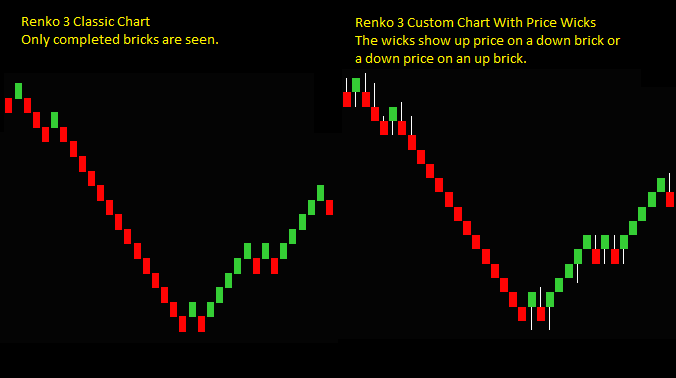
Renko Chart Types – Classic And Custom
The Renko classic chart shows completed bricks. The Renko custom chart shows completed bricks with price wicks. But again, regardless of which Renko chart type the trader uses, all price movement will be seen in real time while making the bricks.
Do Renko Chart Produce False Signals
A Renko chart criticism is for false signals occurring in choppy or sideways markets. In these conditions, also known as price consolidation, there may be a frequent series of up-and-down bricks forming.
Or, there may need more movement to get new bricks, and the resulting price-chop is up and down on the same brick.
However, instead of being false signals, there should be no signals.
The sideways movement is reflective of market conditions that you shouldn’t trade. And why would the same Renko brick give multiple false signals and trades?
Seeing this on a Renko chart is a strength, not a weakness or a negative. These charts accurately show that the market’s state is sideways and uncertain.
What Is A False Signal
And what are Renko charts false signals? Does this mean that a signal becomes a losing trade?
If there are some losing trades, all traders should expect this. No trader will win 100% of the time, regardless of chart type. I would not simply blame a trade loss on a false signal.
Or do false signals mean you go long when it would be better to go short? Or do you go short when you should have gone long?
In this case, I would first look at the trading strategies as the cause, not the chart type. Problems with your trade setups and the direction of the trade would not consistently be a Renko chart issue that didn’t occur on a bar chart or tick chart.
Reasons For Renko Charts False Signals
In more depth, I want to discuss some of the reported reasons for Renko charts false signals. There appear to be 3 basic causes; (1) brick size settings, (2) missing price movement, (3) choppy and consolidating markets:
- The setting of the brick size affects the Renko chart sensitivity.
- If there are no new bricks, then it appears that there is no new price movement.
- The market reverses direction before the price moves the brick size, so you will not see this movement on the chart.
- Renko charts don’t show all the price highs or lows that other chart types do, and again prices will be missing.
- If the market is sideways or choppy, the price may need to move more to make new bricks, or there may be many alternating new bricks.
Renko Brick Size Setting
The setting of brick size in Renko charts will ultimately impact your trade setups and signals generated. But this will also be the case for your time setting for a bar chart or your tick setting for a tick chart.
The chart will be less sensitive to counter-price movements if the Renko brick setting is too high. You may not see minor but significant price changes. Or the chart may continually make new bricks and reverse direction if the setting is too small.
The Renko brick setting is critical to your trading method and strategies. The brick size should reflect the amount of price movement that will capture bigger swing moves when they occur. But the setting should also capture tradeable swing reverses.
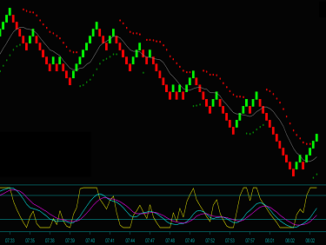
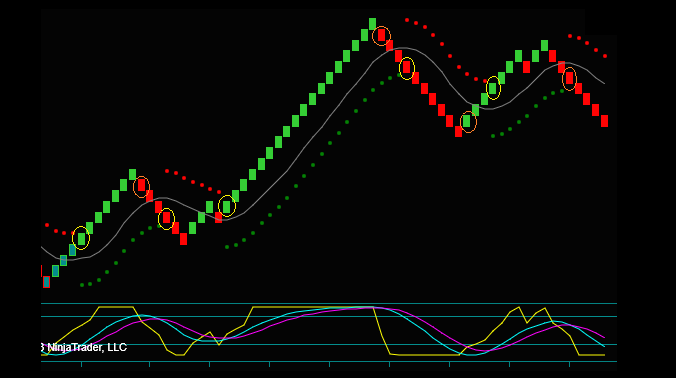
I chose the Renko chart below to show the following characteristics of our trading strategies in market conditions with bigger than average-sized swings and quick reverses.
Price Swing And Renko Brick Size
Here are some of the key takeaways:
- Orange circles price extreme trade setup. You would enter the trade on the first counter brick after 5+ consecutive bricks in the same direction and a momentum indicator extreme.
- Note how these extreme reversal trades fit the previous swing high or low.
- Yellow circles price envelope reverse trade setup. You would enter the trade after a price envelope dots change color and a momentum indicator cross.
- Note how these chart reversal trades captured most of the swing before reversing again.
- And in the case of this chart, when there was a price extreme reverse trade, you essentially captured the whole swing.
- This biggest swing on the chart is larger than typical, and the key is that the price envelope dots remained green with our 3 Renko setting.
You choose the best setting by studying your charts in all types of market conditions. The 3 Renko setting worked very well for this chart and market conditions. But there is no perfect brick setting, time frame, or tick count.
If the chart setting is the cause of false signals [better phrased as too many losing trades], work on adjusting your setting. But all charts can generate false or bad signals – this is not inherent in Renko charts.
Renko Charts Missing Price Movement
Related to brick size as a cause for Renko charts false signals, missing price movement is another reported cause:
- Bricks that are too small will cause the chart to reverse continually
- Bricks that are too large will keep the chart from reversing timely
- Bricks may miss price movement by not showing the highs and lows
And there is one potential situation that website writers don’t typically mention – the Renko chart can miss prices by making multiple bricks simultaneously. These multiple bricks wouldn’t necessarily cause Renko charts false signals – but they could cause a missed trade entry.
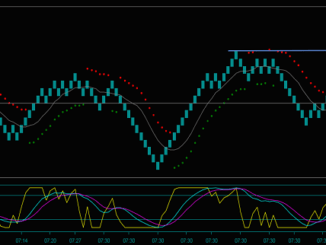
You can see this in the charts below:
- The green bricks on the left chart are all completed simultaneously.
- However, looking at the right chart and the yellow circles corresponding to these trading swings, the multiple bricks did not affect the trade entries.
- Entering into multiple bricks is more typical of our Renko trading strategies. I won’t say it isn’t unnerving when it happens, especially when it doesn’t appear to be a fast market.
- But yes, there are cases where you would miss entering a trade.
Renko Trading Chart With Price Wicks
I am showing you a Renko chart with price wicks to determine how many completed bricks have wicks and how many don’t. You can see that the majority of the bricks don’t have wicks. And in the case of these price swings, the high and low are only 2 ticks that you wouldn’t see on a Renko classic chart.
But anyway, do you miss seeing these prices – look at the last brick on the right chart below and why the answer to this question is no.
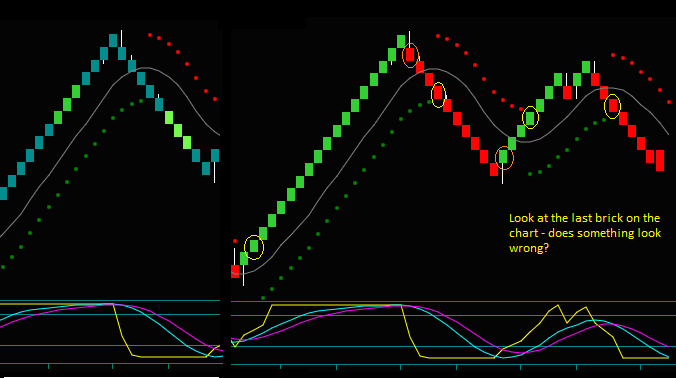
You are looking at an uncompleted real time brick.
The completed bricks on this Renko chart are all 3 ticks, but at this point, you can see 5 ticks of price movement. There can be 8 ticks of real time price movement – you can see an example of this on the green brick to the left of the first yellow circle.
How can this happen:
- The previous brick is red, so it closed at its low – the uncompleted brick has only gone 2 ticks lower, so there is no new brick
- But you can also see the uncompleted brick at the high of the previous brick, which is 3 ticks for a total of 5 ticks of price.
- How would you get a green brick – by going 3 ticks higher than the previous brick high?
That is how you can get 8 ticks of real time price moves, even though the completed bricks are only 3 ticks. That is also why the Renko chart has no missing price movement.
And why you don’t get Renko charts false signals due to missing prices.
Choppy And Consolidating Markets
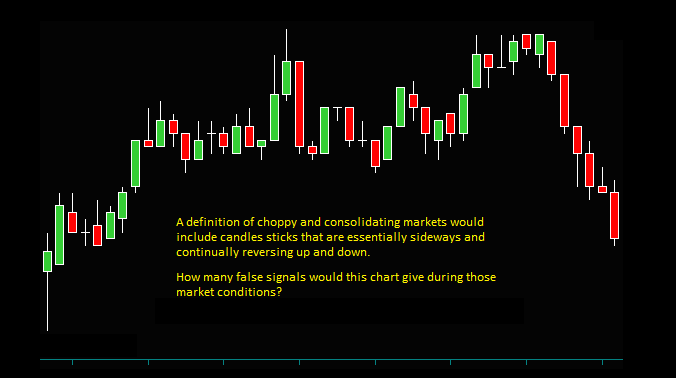
If a chart were going to give false signals, these would be most likely in choppy and consolidating markets. And if a definition of a choppy and consolidating market would include sideways and continually reversing bars, the 5 minute candlestick chart below is a very good example.
How many false signals would this candlestick chart give? And importantly, could you avoid trading the false signals but still trade the good ones?
The answer to this last question is more than a chart type; it includes your trading strategies for that chart. I do not have day trading strategies for timeframe charts and cannot trade them. A chart like this could result in several losing trades from the price chop and consolidation.
Renko Trade Filtering – Avoiding False Signals
I see the potential for more false signals from the candlestick chart than Renko chart false signals, especially if your trading strategies don’t include what I call trade setup filtering.
I discuss trade filters throughout this website – check the links below:
- Renko Trading Strategies And Filters
- Renko Chart Trade Filters And Consolidation
- Renko Trade Setup Filters Video
Trade setup filters are very important to our Renko strategies.
What Is A Renko Trade Filter?
A trade filter is a condition with a trade setup that avoids taking the trade. There are 3 trade filters:
- Do not trade against price momentum
- Do not trade without 3+ bricks to price support or resistance
- Do not trade inside of consolidation
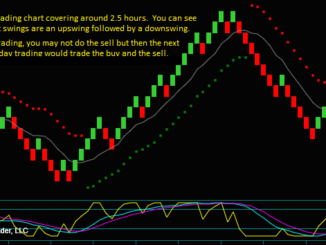
I do not see the same degree of Renko chart consolidation that the candlestick chart showed. There is more of a range-bound market after the ‘bigger’ upswing.
But there are numerous brick reverses. These would be trade losses, not so much from Renko false signals but from price movement that does not continue the upswing.
However, that is until you recognize the gray line on the Renko chart as support and filter trades for that price. Why is the gray line price support?
Because further to the left of this chart was a double top that was price resistance. So, after the breakout, this same price shifts back to support.
Filtering trades that do not have 3+ bricks of room to the price [blue circles synched with the price envelope dot shift] avoided the trades and what would have been multiple losses. Yes, the last blue circle would be a winning short trade – but that is the 5th trade in the series of 5 trades.
Similarly, you would not trade blue circle3 because there were only 3 bricks of room to the high and a potential double top.
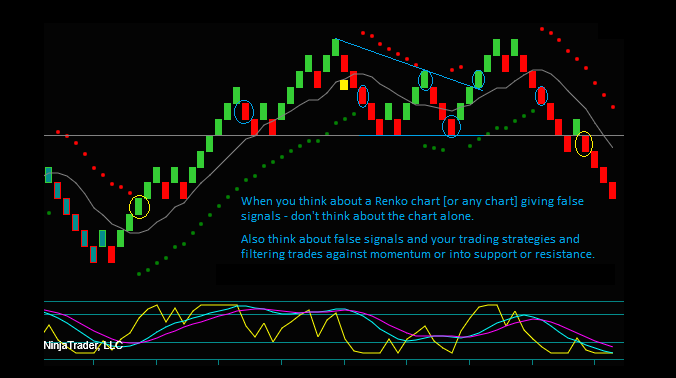
That price support line explains why the candlestick chart was so choppy and consolidated. And then the double top high explained why there was more consolidation.
If you used this timeframe chart for day trading, could you have avoided the constantly reversing candlesticks and false signals as you could on this Renko chart?
And do this while only trading the 2 yellow circles [or blue circle5]. How many trades would the 5 minute chart give you for this period?
Renko Charts False Signals
We have discussed false signals from Renko charts and the different reasons they can appear to occur. As well false signals have also been discussed on candlestick timeframe charts.
The chart examples looked at brick [timeframe] settings, prices you missed, and markets that are choppy or consolidating.
All charts need settings; the setting alone cannot be the cause of false signals. And all markets will be choppy or consolidated.
This market condition can lead to false signals and many trading problems. It is very important to have trading strategies and filters to help avoid them. Seeing consolidation on a chart is a positive – it is a period to avoid trading.
I also explained how prices are not missing on the Renko charts in real time while trading. Also, note how much price the large candlesticks contain, simply because you are waiting for its completion timeframe.
How much price action do you miss from not seeing extra bars [bricks] as the Renko chart has?
I like Renko day trading charts far better than timeframe charts. But the bigger point – do Renko charts have false signals because of their chart type?
Yes, you will have Renko chart losing trades. All trading methods and strategies are going to have losing trades. But these Renko chart false signals are not inherent to the chart type.