This article will talk about the Renko charts disadvantages and the cons when using them for trading. I will discuss these potential shortcomings from my experiences. And I will especially focus on whether these are real disadvantages of trading with Renko charts.
If you do a Google search for the words’ Renko Chart Disadvantages’, you will find numerous articles. I did this to get these disadvantages and cons to discuss.
| But something I often couldn’t get a sense of was whether the authors were experienced traders or just writing articles. |
This difference would be important for learning to trade with Renko charts.
What are the reported disadvantages of Renko charts – here are the ones I want to discuss:
- Lack of time information
- Delayed signal generation
- Loss of price information
- Limited backtesting
- Brick size selection
- False trading signals in choppy markets
Which ones of these supposed disadvantages are real cons for trading with Renko charts – and which of these is actually a trading advantage?
These are very important Renko trading questions and necessary to understand before trading with Renko charts.
What Is Different About Renko Charts
Renko charts are unique in the way they plot price data. Their name comes from renga, which is a Japanese term for bricks. These bricks are what you see when looking at a Renko chart.
The chart bricks show specific price changes only. Price only contrasts with the traditional candlestick or bar charts that plot price versus time. And like these other chart types, the Renko bricks also do not include volume.
Although this approach can simplify chart analysis, does it also cause cons and limitations for Renko trading?
Lack Of Time Information
Renko charts are price charts only. The bricks on the chart show the same fixed price movement regardless of the time needed to complete the brick.
| Yes, Renko charts ignore time. But does the absence of trading with time intervals make it hard to evaluate market volatility accurately? And is no timeframe a con for Renko chart trading? |
I do not think so, and especially could not day trade with time charts.
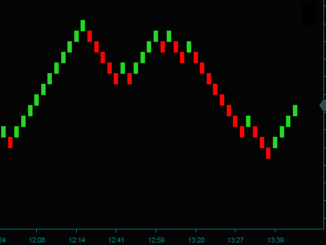
Look at the charts below that compare a 5 minute candlestick chart with a 3 brick Renko chart for the same amount of time. Consider 5 minutes and 3 bricks as day trading charts.
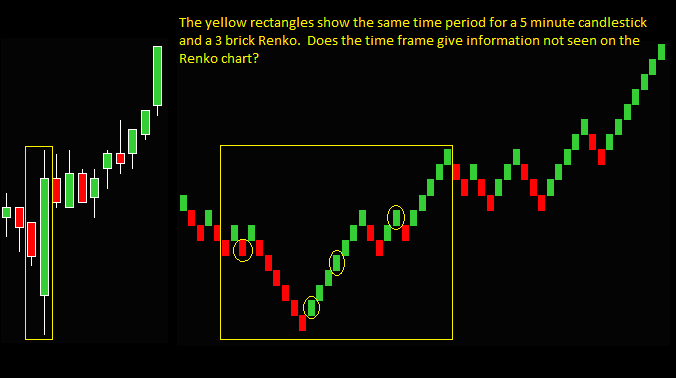
Especially look at the biggest candlestick with the same period on the Renko chart:
- Consider that the candlestick shows more volatile trading.
- It is the biggest bar on the chart, opening well below the previous down bar close.
- The bar then goes lower before making a big upside reversal.
- How do you evaluate that bar – and more importantly, how do you trade that bar?
- The additional Renko bricks give far more information for analysis. As well, there are tradeable setups from our Renko strategies.
- Including the previous down candlestick, the Renko chart has a sell setup and then 3 buy setups inside the reversal bar.
These charts show that the lack of time information for Renko charts is not a disadvantage or con for trading. The candlestick time frame bar lacks information.
Delayed Signal Generation
As a price only chart, there must be a certain amount of price movement before completing a new brick. The chart above is a 3 brick chart, meaning that the size of each completed brick is 3 ticks of price.
The supposed disadvantage of this is missing trading opportunities while waiting for a brick to complete.
But why is this a disadvantage for a Renko chart that doesn’t exist with any chart type if you are going to wait until a bar completes before trading? For instance, you would have to wait for a 5 minute candlestick or a 120 tick bar to complete.
A potential delay for a trade signal could occur for any chart type if the trader decides to wait for the bar or brick to complete. A trader could decide to trade intra-brick or intra-bar. Waiting is not inherently a Renko chart disadvantage.
Renko Charts Disadvantages From Loss Of Price Information
Another Renko chart disadvantage I read about is that they filter out smaller price movements. Thus, the only price you see on the chart is that of the brick size, and detailed price information is lost.
| Filtering out these smaller price moves can eliminate noise from the chart. The missing prices may be important. But are these prices really missing? |
For instance, consider a brick size 3 that completes as an up brick, where the brick before was down. Consider what that means by looking at the yellow rectangle on the chart below:
- The previous brick goes down and closes at its low
- The next brick goes down 2 ticks lower – thus making no new down brick
- The brick reverses and closes 3 ticks higher than the down brick high – thus making a new up brick
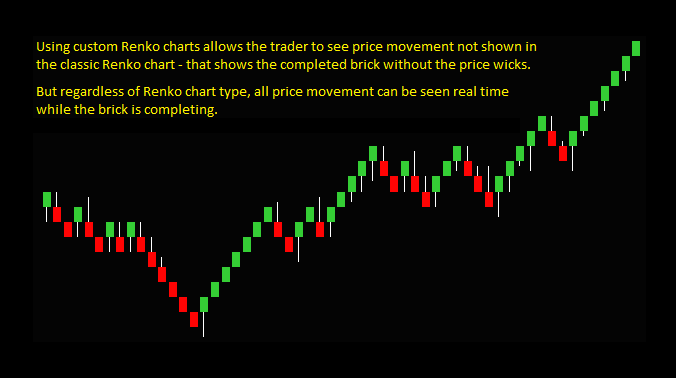
The Renko brick price movement describes 5 ticks not seen on a classic Renko chart. You would only see the completed up brick.
Where missing price would be a potential disadvantage is knowing the swing highs and lows.
However, the missing price movement is only the case for a classic Renko chart. Custom Renko charts with price wicks show the price movement. And all price movement is seen in real time, regardless of the chart type.
A lack of detailed price movement is not a con for trading with Renko charts. Renko charts false signals do not come from missing price points.
Limited Backtesting And Historical Analysis
Related to a lack of detailed price movement would be a limit in backtesting and analyzing previous trade setups.
Again, the premise would be you lose accuracy because of the missing price. But again, I don’t see this as an issue.
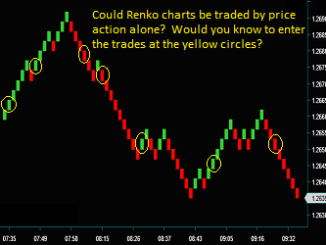
Look at the Renko trading strategy chart below. The 5 yellow circles are the trade setups for the period discussed above.
I can study these trade setups and their related components without missing prices included. And if I cared, I could evaluate on a Renko chart with wicks.
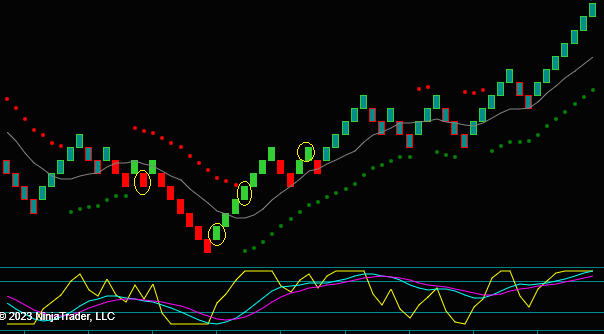
Look at the 2nd yellow circle:
- You know from the price wick [chart above] that there are 5 ticks of missing price
- But these prices are not part of the trade setup
- The setup is a Renko strategy called a price extreme reverse – the trade would be a buy
- There must be 5 or more consecutive down bricks after the price envelope reverse or last trade setup
- The blue and purple slow momentum lines must both be below the extreme line
Buy the circled green brick. Price is not a setup component of the trade. And missing price did not limit my ability to analyze the previous trades.
Brick Size Selection And Lack Of Standardization
I will agree that selecting a Renko brick size for trading is not standardized. And that the brick size impacts the chart appearance, along with the trade setups.
But you need to agree that this would happen with any chart. Time frame charts, tick charts, or any chart with a setting would have the same situation.
A lack of a standard setting is not a disadvantage for trading with Renko charts – it would be a con for trading with charts. But then, how are you going to trade?
Renko Charts Disadvantages From False Trading Signals
What is most interesting about this Renko chart disadvantage?
| The issue is Renko charts give a false signal in choppy or sideways markets. But this is an advantage of the charts – not a disadvantage, and an example of what I meant when wondering if the authors of other articles were traders. |
I want to talk about false trading signals at greater length, as this would be a serious drawback against any chart. I will discuss how our Renko trading strategies would handle price consolidation.
Consider the following statement:
- The chart may generate false trading signals when price movements do not consistently exceed the brick size setting.
What does this mean? You will not get new bricks if price movements don’t exceed the brick setting. How many signals are you going to get on a single uncompleted brick?
The condition described as a choppy and sideways market is called consolidation. Traders have probably lost more money in price consolidation than in any other market condition.
So, a Renko chart showing consolidation is good! And by the way, timeframe and tick charts would do so too.
If Renko charts and your trading strategies show consolidation, this is an advantage for trading, not a disadvantage or con.
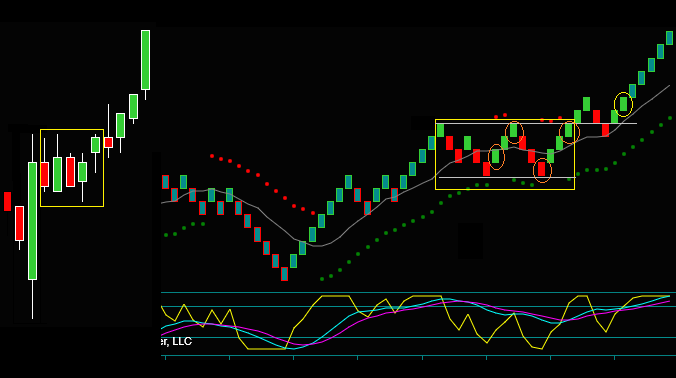
Look at the 2 chart periods inside of the yellow rectangles. You can see these times of price consolidation on both the time frame chart and the Renko chart.
Is this a disadvantage in being able to see consolidation? Could you profitably trade inside of consolidation?
Renko Chart Price Consolidation
I want to discuss further why getting sideways and choppy markets on a Renko chart is an advantage, not a disadvantage – a pro for trading with Renko charts and not a con.
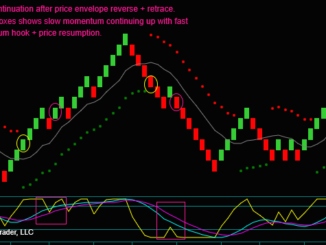
Look at the Renko chart shows 4 orange circles. These circles would be potential trade setups called a price envelope reverse, where the chart’s green and red dots shift colors.
This setup is typical of consolidation and leads to numerous losing trades. Seeing Renko chart consolidation is an advantage, and seeing it is one of our key trading strategies – some of the characteristics are:
- Green bricks combine with red dots or red bricks with green dots.
- Note orange circle1 – this would not be a sell because we do not sell green bricks regardless of the price envelope dot color.
- The green and red dots quickly shift colors.
- The gray midline inside of the price envelope dots is horizontal.
- Price remains in a tight range – look at the 2 gray lines.
- Momentum [blue-purple lines] is flat and does not go from extreme to extreme – look at orange circle3.
But as often happens – there would be a consolidation breakout. The breakout may be profitable, but that trade would come at the expense of losing trades.
How Our Renko Strategies Would Handle This Price Consolidation
None of the 4 orange circles are tradable; our method filters trades for consolidation. After the consolidation breakout, there would be a trade at the yellow circle:
- Consolidation range breakout
- Momentum line cross of blue over purple
- After the breakout, there is a price retrace to the top of the consolidation range and the gray midline.
- Note how the blue line stays above the purple line on the price retrace.
Buy the yellow circle as a price continuation trade after the consolidation breakout. Again, the timeframe chart showed the same consolidation. But I do not see a buy setup, just a consolidation breakout only.
Renko Charts Disadvantages – Real Or Not
I have addressed my experiences with Renko charts and what I have read as commonly written disadvantages.
These disadvantages are generally common to trading charts but not to Renko charts. And in some cases, the supposed Renko disadvantage is actually an advantage.
Renko Chart Issue Not Written About
One characteristic of Renko charts is an issue. And this issue is not typically written about as a con for trading. The trader does not know when a Renko brick will complete.
Yes, all of the bricks on a Renko chart are the same size, but they can all take different amounts of time to complete. This time difference would not be an issue for a timeframe chart but would exist for a tick chart trader.
However, the trader does know what price the Renko brick will complete. And if the trading strategy components are seen intra-brick, you can make your trade if the brick completes.
Renko charts are unique as charts made from the same size price bricks. A combination of price and momentum-based trading strategies can provide a successful way of day trading.
If you have traded with Renko charts, you ultimately know that a Renko trader’s success would depend on their strategies and trading skill. And their problems will be due to more than potential disadvantages from Renko charts.
I have considered many chart types for day trading. And as discussed, trading problems can occur with all of them. It would be best if you didn’t single out Renko charts disadvantages.