Our key Renko trading tips and learning guide for Renko chart day trading include how to set up your charts and the brick settings to use. Additionally, I will discuss the best Renko trading indicators, setups, and strategies for day trading.
But before going through the Renko trading tips, I want to introduce this chart type and what makes them unique.
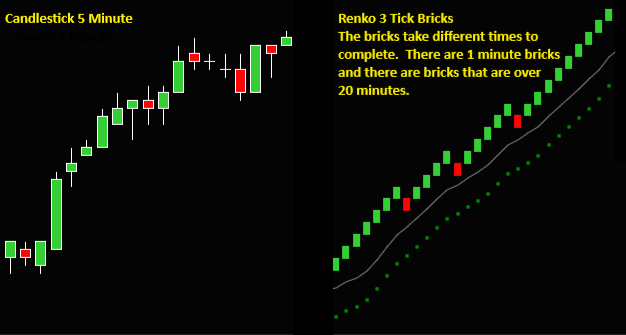
Renko charts are price charts, significantly different from the traditional candlestick charts you may be accustomed to trading. They turn price data into bricks, disregarding time or volume.
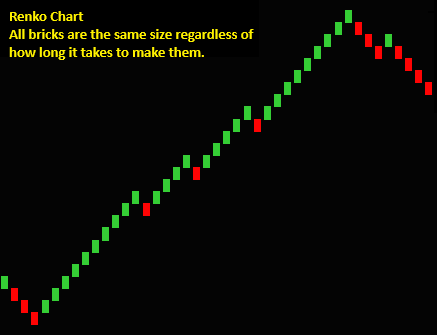
Renko charts do not have a uniform time axis. The bricks are added based on price movement alone, regardless of how long it takes for this movement to occur.
Each brick on the Renko chart represents a specific and constant price move of the same size. For instance, if a trader uses a setting size of 3 ticks, then that will be the size of each brick, and price moves of a smaller size will be eliminated from the chart.
Eliminating time and the filtering of smaller price moves is what differentiates Renko from other chart types and can make the charts clearer to read for trading
Tips For Day Trading With Renko Charts
The Renko trading tips discussed focus on effectively trading Renko charts and developing a day trading method and strategies.
Renko Day Trading Tips And Guide Key Takeaways:
- Renko Chart Essentials: Understand the unique construction of Renko price charts and their benefits for day trading.
- Renko Chart Settings: Choosing the best Renko chart settings and brick sizes for your trading style.
- Renko Trading Strategies: Learn how to select the brick sizes, indicators, and trade setups for Renko chart day trading.
- Renko Trade Setups Without Indicators: Although your basic Renko trades may use indicators, there are very good setups using chart patterns and breakout strategies.
- Renko Trading Platform: Finding the best trading platform for using Renko charts and also has a programming language.
Renko Trading Tip #1: Understand The Benefits Of Price Charts
If you are going to day trade, a key tip is to learn about the different chart types available and what makes price charts unique.
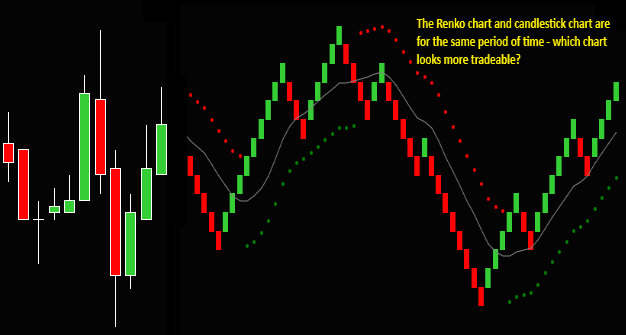
Renko charts are constructed based on price only, with each brick showing a specific price move independent of time. A chart that uses price only significantly differs from candlestick charts, which show how much price has moved over a specific amount of time.
Using timeframes for charting can lead to a lot of ‘noise’ and small meaningless bars on a chart that the Renko chart doesn’t show.
I especially don’t like the continuous combinations of small overlapping bricks and bigger breakout bricks on the candlestick chart. At the same time, the Renko price chart eliminates the inconsistencies in the candlesticks and shows a clearer price move.
And on this Renko chart-candlestick chart comparison, look at how erratic the candlestick chart looks for 55 minutes of time. During the same period of time, you can see the same 2 moves down and up, but the Renko chart looks nicely tradeable.
Renko Price Chart Key Question
If prices smaller than the brick settings are eliminated, does that mean that trading with Renko charts makes you miss some price points?
This is a key Renko trading tip about price charts that must be understood. Although some prices may be missing from a completed Renko chart [any price moves smaller than the brick size], all price points are seen on the charts in realtime. Importantly, no prices are missed while trading.
Renko Trading Tip #2: Renko Brick Reverses Aren’t Trade Setups
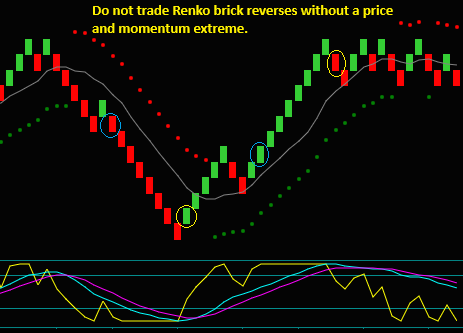
Another key tip from my experiences with Renko charts is not to trade brick reverses as signals.
Have you done searches for trading with Renko charts? Did these searches show charts without indicators and big trends traded from signals based on the bricks reversing from green to red or red to green?
These trends look good in hindsight, but how would you know when it began? You would not know this simply from seeing a Renko brick reverse or color change.
I do not trade the Renko charts with the bricks only. My charts have a group of trading indicators that are used in combination to make Renko trade setups.
Look at the circles on the chart below. Although they may look like trades done when the Renko brick color changed, they are trade setups and those were the entry bricks – this is an important distinction.
Trade signals may tell you when to buy or sell. It could be from a Renko brick color reverse or a moving average cross. However, these mechanical signals do not involve any further Renko chart analysis.
They do not take your Renko trading method indicators and turn them into trade setups that also include filters for lower odds trades.
So, my further trading tip is to recognize that trade signals are not trading setups or strategies and will not be as effectively traded.
Renko Trading Tip #3: Selecting the Best Renko Chart Settings
Your Renko brick setting is a key component for Renko chart trading, as the size of the brick determines the chart’s sensitivity to price movements.
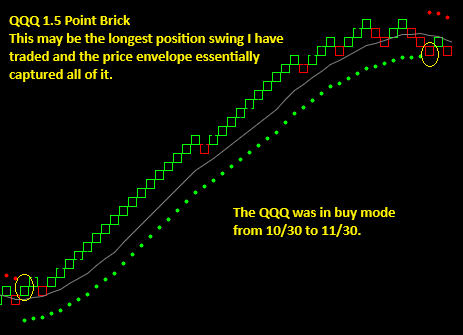
You will select a brick size based on your trading style. Renko day traders will select a smaller brick size, while Renko position traders will choose a larger size. For instance, my Renko day trading charts for the British Pound future are 3 ticks, while I use a 1 and 1.5 point brick for position trading the QQQ and SPY.
The key Renko trading tip for selecting brick sizes is recognizing that there will not be a ‘perfect’ brick size for your trading style or strategies. Of course, the same can be said for any chart type.
Your brick size is a balance. A brick size that is too small might lead to overtrading due to the number of setups, while a brick size that is too large might cause you to miss out on short-term opportunities.
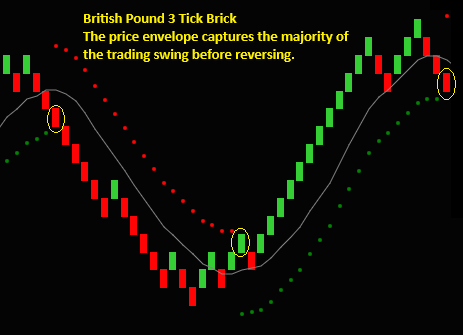
When I selected Renko brick sizes, it was based on a price envelope momentum indicator that determines what I call chart mode or the direction in which I will be trading.
I have 2 objectives for the combination of brick size and indicator:
- I want to ensure that this indicator can typically capture the majority of a price move without reversing.
- I want the indicator to reverse before missing much of a new swing.
Renko Trading Tip #4: Selecting The Best Renko Trading Indicators
The Renko tip for selecting the best trading indicators actually includes multiple tips.
Renko Indicator Tip 1: Make sure any indicators you consider will work with Renko charts. Since a Renko chart is a price chart, do not use an indicator based on time or volume.
Renko Indicator Tip 2: Be sure the indicators fit your trading style. Are you day trading or position trading? If you are day trading, you will have more trades and will want indicators that show price reverses and extremes. But if you are position trading, you will want indicators that show trend continuation.
Renko Indicator Tip 3: Do not select indicators that cannot work together, where 1 indicator shows one thing but another indicator shows something completely different. In that case, your indicator combination would be very confusing and cause difficulties in deciding which indicator to follow.
Renko Indicator Tip 4: Do not try to trade a single indicator as a buy or sell signal; trade compatible indicator setup combinations.
The Best Renko Trading Indicators
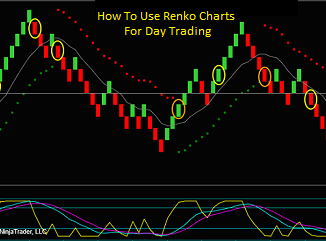
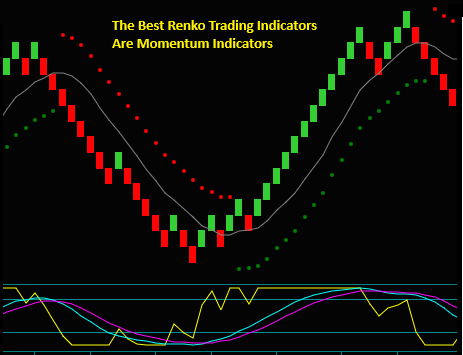
I found momentum indicators to be the best for Renko day trading. My trading method is based on momentum expansion leading to price continuation, with momentum extremes leading to price reversals.
The Renko trading chart above shows the 3 momentum indicators I have customized. These momentum indicators are used in combination as trade setup components.
- The price envelope indicator [on the Renko chart] shows when the price reverses for a sell or buy, providing the slow momentum indicator [blue-purple lines] has crossed in the direction of the trade.
- The fast momentum indicator [yellow line] is a continuation indicator. The indicator is used with the slow momentum indicator and the price envelope, showing a momentum resumption after a price retrace.
- The slow momentum indicator is used as described above to confirm a price reverse and/or momentum resumption. When this indicator becomes extreme, it shows potential swing reverses.
If you are going to day trade Renko charts with indicators, then you want to select the best indicators for trade setups that show price continuing in the direction of your trade.
The Best Renko Trading Indicator Is Momentum
My key Renko trading tips are that momentum indicators are the best, and you shouldn’t try to trade indicators as mechanical signals.
Renko Trading Tip #5: Selecting The Best Platform For Renko Charts
Are you considering Renko trading? Then, here are some tips for understanding Renko charting and selecting your trading platform:
- Renko charts are not available on all trading platforms.
- Renko charts do not necessarily look the same on all platforms offering this chart type.
- All data sources cannot make a Renko chart; be sure that the charting program has tick data, or you cannot make a Renko chart.
- Select a charting program that has a programming language so you can make custom trading indicators.
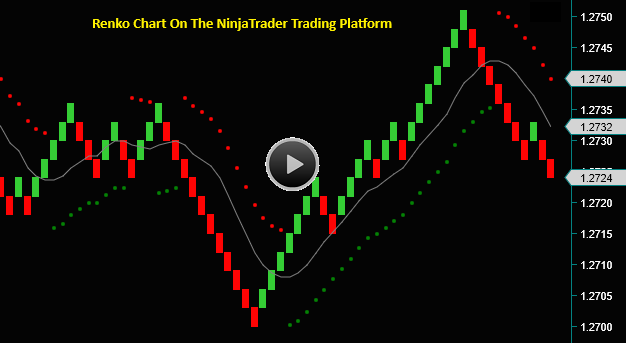
The chart below shows a British Pound Renko chart on the NinjaTrader trading platform. NinjaTrader is my favorite program for Renko chart day trading for multiple reasons.
The following video discusses my tips for selecting the best platform for Renko charts and why I like NinjaTrader.
- Charting programs in general.
- Discussion of a trading program that tries to make Renko charts without tick data.
- Compare and contrast NinjaTrader Renko charts with another trading program I use.
- NinjaTrader programming language where you can make custom indicators and even custom brick types.
Click on the chart to watch the video discussing tips for the Renko trading platform.
Tips For Making New NinjaTrader Renko Charts
If you are new to NinjaTrader, click on the link below for tips on how to create a new Renko chart and add trading indicators. I have made two videos that will show you how to do this.
NinjaTrader Renko Charts And Trading Indicators
Renko Trading Tip #6: Renko Setups That Don’t Use Indicators
A Renko trading tip for trade setups would be to include Renko setups that don’t use indicators.
Although our ‘base’ Renko method trade setups use indicator combinations, some of our best trades don’t use indicators. Instead, the setups come from Renko chart patterns and breakouts.
I especially like chart pattern breakouts because:
- They are price and momentum continuation patterns
- They are momentum resumption patterns
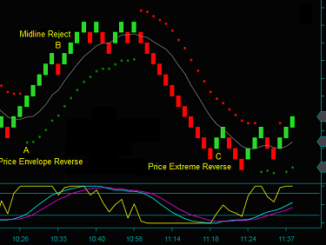
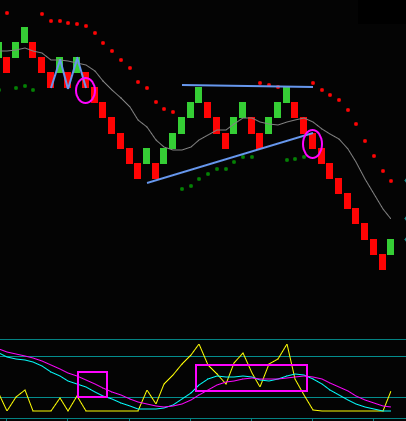
Renko Chart Price Breakout
I would call the purple circle a combination of momentum resumption and continuation.
The blue horizontal line was price support to the left of the chart, and you can see how this price has shifted to resistance. Look at the blue-purple lines [slow momentum indicator] under the chart and how they have drifted down and essentially become one line as the resistance price holds.
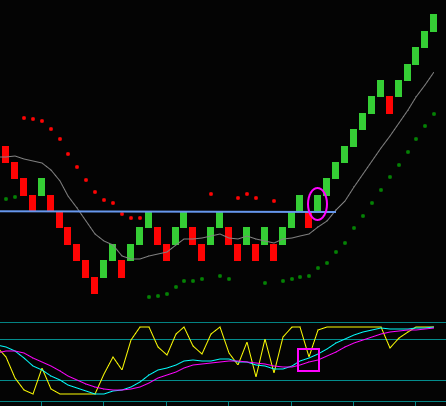
Then look at the first Renko green brick breaking the price line with the slow momentum indicator cross. After the break, there is a price retrace after the break, but slow momentum continues to increase.
When the 2nd green Renko brick is made at the purple circle, you buy the price breakout with continuing momentum. This is a good breakout setup because it indicates that the price line is failing to be resistance.
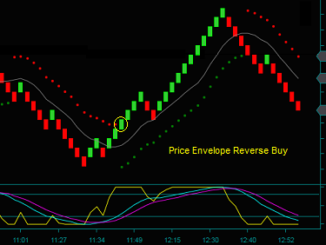
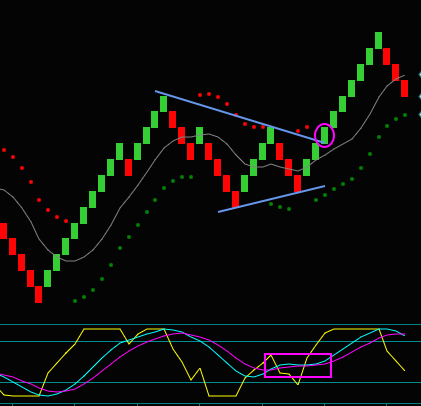
Renko Chart Triangle Pattern Breakout
The Renko chart triangle breakout is a momentum resumption trade setup.
As you can see from the chart, as the price compresses into a pattern of higher lows and lower highs, momentum moves sideways. But when the triangle pattern breaks out, momentum resumes and leads the price in the direction of the trade.
I think of a triangle breakout like letting go of a compressed spring. You can squeeze a spring until it won’t compress anymore. And then, when you let go, the spring flies into the distance – just like a triangle breakout.
Renko Chart Pattern And Momentum
Continuing with Renko momentum and pattern trading tips, the following chart shows a price breakout with momentum continuation and a price breakout with momentum resumption.
Renko M Pattern: This is a price breakout pattern. You can see the M drawn on the chart and how it includes up-down price movement, but with momentum continuing to flow down in the direction of the trade. The M breakout is with the momentum that leads to the price breakout.
Renko Wedge Pattern: This momentum resumption pattern is similar to the Renko triangle pattern. Where the triangle pattern has higher lows and lower highs, this wedge pattern has higher lows but flat highs like a double top.
What is the same between the 2 patterns is momentum and how it moves sideways while the price is inside the pattern. Then, the pattern breaks out, momentum resumes, and the price continues in the direction of the breakout.
Renko Trading Guide
These Renko trading tips should be helpful for more effective day trading. You can also find more Renko trading tips for indicators, day trade setups, and strategies in the following Renko trading guide: