Renko price action is the trading reaction to important price areas or inside chart patterns. Price action is especially significant when it is at chart support or resistance or when trading inside a pattern that won’t break out.
And the breakout of chart patterns are effective Renko price action setups. See the charts below for Renko triangle, wedge, and M W pattern trade setups.
Price action is not simply up and down price swings on the chart or the Renko bricks changing color from green to red or red to green. You could call that price movement – but there is no inherent action that is significant for trading.
Renko Price Action Key Takeaways
|
Look at the chart below – there is Renko price action [not simple price movement] at each labeled point.
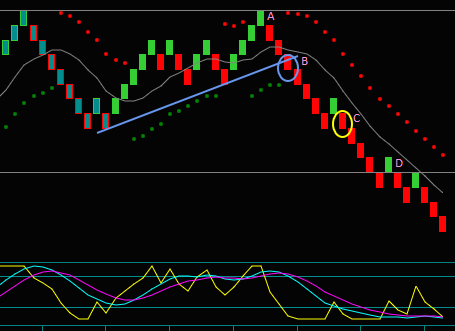
- A: Price moves to resistance – the price action is the rejection and swing reverse.
- B: Price moves to trendline support – the price action is a trendline breakout and swing continuation.
- C: Price retraces in a downswing – the price action is the swing resumption led by fast and slow momentum.
- D: Price moves to support – the price action is not a rejection and reverse, but instead a failure break reaction, where this price doesn’t remain support, and the swing continues again.
Again, Renko price action is not the downswing at the left of the chart or all the brick color changes before point A. It is the reaction at significant price points or key price moves that cause a swing to reverse or continue.
Examples Of Price Action On Renko Charts
What is a price action reaction?
A price action reaction seeks to answer what would typically happen to your trade. For example, what would the reaction be for a buy trade if you did the trade 1 brick from price resistance with negative momentum?
- What would the price action at resistance be?
- Would the price break out and continue for a winning trade?
- Or would the resistance price hold, leading to a reverse and a losing trade?
You can see that evaluating the Renko price action and reaction for your trading decisions is far different than watching price movements and swings on the chart. It is an important part of learning to trade with Renko charts.
Several Renko patterns have price action breakout potential along with price action at significant prices. I will further discuss the triangle, wedge, W, and M patterns – and the double midline reject that is a pattern specific to our Renko strategies.
I like the price action and reaction for these patterns. Along with how clearly they can be seen with the bricks on a Renko chart.
Renko price action [price + action] includes the evaluation of movement across the chart. I have a buy signal, or a sell signal is not an example of price action; it is a trade setup.
Visualize Renko Price Action
Below are some examples of price action and how it may affect a given trade:
- You have a Renko buy setup.
- But the entry price would be directly into the highest price in the last 2 days.
- Do you still take the trade that would be at a double top of this resistance price?
In our Renko chart strategies, even though there was a method trade setup, we would not make the trade in this case. We would filter the trade setup for price resistance.
Filtering the trade comes from studying price action at significant prices. The odds are greater for a double top high and price reverse than a breakout and profitable trade.
- You did not make the trade in the previous example.
- Price breaks resistance and then moves back below it.
- Momentum continues to go up during the price retrace.
- The price breaks a second time.
Does the price action described change the trading decision for not taking the trade because of price resistance?
Our Renko strategies would view this scenario differently than the initial buy setup. We would call the price action described as a price resistance failure break – meaning that the price now fails to be resistance still.
While the first buy setup was price filtered, you would now take the trade due to the Renko price action.
Renko Price Action – Reaction To Key Price And Pattern Areas
The Renko chart below shows the price failure break described above. Also included are chart reads for price action and trades related to pattern breakouts.
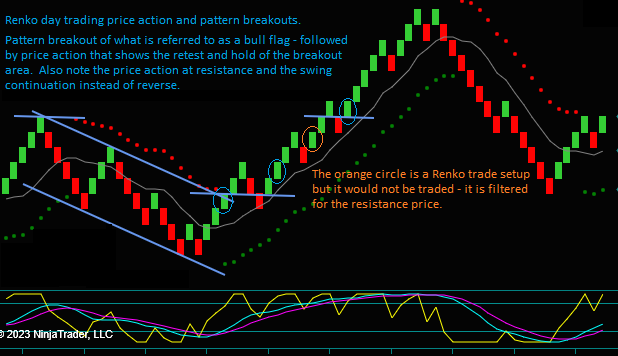
Let’s first evaluate the Renko chart for price and patterns and then how these areas are affected by price action and the related Renko price action trading decisions.
The purple line at the left side chart high is resistance.
- The price was initially the day’s low after a ‘big’ selloff.
- We call these prices a shift line – meaning that they were support and shift to resistance or were resistance and shift to support.
- They are significant because of the Renko price action that often occurs.
- What is a price action price-shift line?
- Renko Shift Line Price Action Video
Price Action And Price Reaction
The 2 parallel lines going down from the resistance price are a retrace channel.
- Note that this pattern includes the retrace to where a previous upswing began.
- Purple circle1 is a price pattern-price action trade, a channel breakout buy.
Purple circle2 is a Renko strategy for trading the price action related to the channel breakout.
- See the retest of the price channel break out – the 2 red bricks.
- Also included is the test of the rising price envelope midline.
- The test, or price retrace, includes rising momentum – blue-purple lines.
- Also included is a fast momentum hook – the yellow breaks its extreme, moves back below, and breaks it a 2nd time.
- We call purple circle2 a midline reject with momentum flow and a Renko price action trade due to its relation to the price channel breakout.
Orange circle1 and purple circle3 show an example of the Renko chart scenario described above.
- You cannot trade the orange circle because it is directly into the resistance price.
- But then, after the resistance price break and retrace with rising momentum – buy the 2nd break of resistance.
Purple circle2 a price failure break trade – the price fails to remain resistance. The price action for support or resistance failing is an important trading strategy because it often leads to price continuation.
This evaluation of chart prices and patterns is a good example of Renko price action and what it is. It should be evident that price action differs from price movement or the bricks simply changing color.
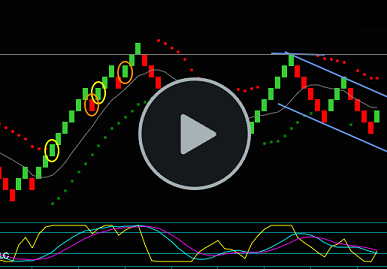
Renko Price Action Video
In a video, I will discuss this chart and Renko price action in greater detail, emphasizing price action-related trading decisions.
The video will continue to discuss price action at the significant prices and the channel pattern. And remember the shift line discussed in the video above – you will see its continued relevance.
I will further emphasize the differences between price action and price movement. And I also want to discuss the differences between price action and Renko trading strategy setups – all trades do not necessarily include price action or patterns.
Renko Price Action Patterns
You have seen the importance of price action and the reaction of trading into significant price points. For our Renko day trading strategies, it led to trade setup filtering and a method-based way for avoiding lower odds trade setups.
You have also seen how a filtered trade can be tradeable, again based on a price action reaction. I am now referring to a price failure break or breakout.
The price action concept is where a resistance or support price fails to be resistance or support. These Renko breakout trade setups often lead to price swings that are bigger than average sized.
And you have seen a price channel pattern breakout with further price action, including a successful hold of the breakout area, followed by price continuation.
What other price action breakout patterns are important to our Renko chart trading strategies?
Renko Triangle Pattern Breakout
As an example of the potential for a big breakout move, the triangle pattern is one of my favorite Renko price action trade setups.
I compare the price action to what happens when you compress a spring as tight as possible and then let go. The key to the pattern is the higher low and lower high after a ‘big’ swing in one direction and a retrace in the other – the concept of compressing a spring.
The breakout, which could be in either direction, is typically a bigger swing as momentum goes from sideways to an extreme.
Remember breakout price action, where double tops-bottoms tend to hold and reverse, but triple tops-bottoms tend to break. The triangle breakout is a triple break, considering the 2 points that make the 2 trendlines – see the blue circle on the chart below.
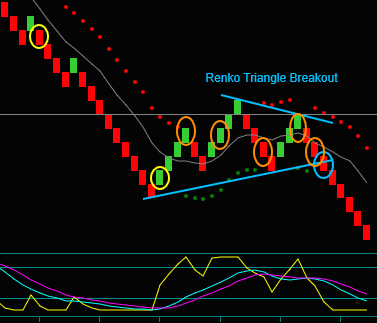
Let’s look at the triangle pattern further and the related price action – both for the swing going into a triangle and the eventual breakout.
- Price often moves into a sideways range or triangle after a larger swing. You can see the sell swing on the left side of the chart. The yellow circle is an addon trade, with the initial sell from a higher price – followed by the price extreme reverse buy at yellow circle2.
- Look at the price action on the move back to resistance and then into the triangle pattern.
- The price can’t reverse as it tries to break resistance [the price line was a double top to the left of this chart], but the selloff also can’t make lower lows.
- The orange circles are all price envelope reverse setups you wouldn’t trade because of the anticipated price action.
- The buys are all filtered for the price, and the first sell is before the momentum cross.
- The anticipated price action-reaction avoids 4 losing trades.
- The 2nd sell setup is inside the triangle pattern and into the upside trendline as support.
Sell the blue circle triangle breakout and see the price move to lower lows. This price action is the basis for the triangle pattern trading strategy.
Renko Wedge Pattern Breakout
Similar to the triangle pattern is the wedge pattern; it’s also a Renko price action breakout pattern. The pattern has a falling-rising trend line on one side with a double top-bottom on the other. The breakout is through the trendline.
Keys to this pattern are trading the breakout while avoiding as much trading as possible inside the pattern.
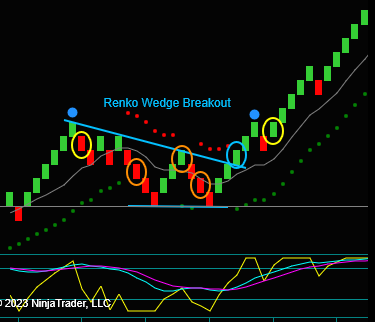
Price action for breakout patterns comes with a resumption-breakout of momentum and bigger price moves. On the other hand, price action inside the pattern has little momentum.
- Like the triangle, the wedge price action is a retrace pattern after a ‘large’ swing. Price retraces without reversing, but the preceding direction doesn’t continue.
- You see the yellow circle price extreme reverse, and then the price move into the wedge.
- You avoid the orange circle sells by filtering for the support price – this is a good shift line example as it was double top resistance shifting and holding as support.
- You avoid the orange circle buy from filtering for momentum – the blue line is below the purple line.
- You see the yellow circle price extreme reverse, and then the price move into the wedge.
- This Renko wedge breakout would be a bull wedge – meaning that the breakout is to the upside and in the direction of the price swing before the wedge.
- For this example, the wedge break synchs with the price envelope reverse. But remember, this is a price action pattern trade, not an indicator trade.
Buy the blue circle wedge breakout and see the price move to higher highs. This price action is the basis for the triangle pattern trading strategy.
Additionally, the price action from the breakout comes with expanding momentum and gives a good addon setup at the yellow circle:
- Midline reject with a fast momentum hook and momentum flow [the blue and purple lines move up on the retrace]. And the triple break of the high into the wedge pattern gives additional breakout price action.
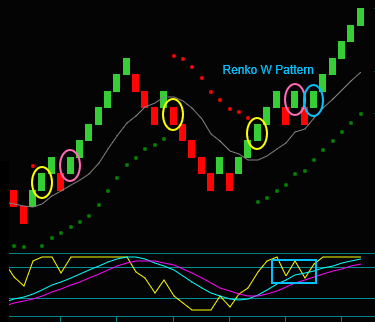
W M And Double Midline Reject Pattern Price Action
Where the triangle and wedge patterns have price action breakouts after a retrace, the Renko M and W pattern and double midline reject are continuation patterns.
Their Renko price action is intended to continue the direction of the price envelope reverse and are addon trading strategies.
The midline reject is our price continuation trade setup – see the2 purple circles following the yellow circle price envelope.
- The purple circle midline reject trades are addons to the yellow circles. Consider the momentum differences between these 2 setups and the anticipated price action.
- Yellow circle price envelope reverse where momentum changes from negative to positive or positive to negative.
- Purple circle midline reject has 2 components: (1) fast momentum hook showing resumption that would lead the price and (2) slow momentum flowing in the direction of the trade on a price retrace.
- The anticipated price action is for price continuation.
The basis for the W M pattern is the price action from the midline reject momentum components didn’t give its anticipated reaction – increasing the odds for a price action reaction on the 2nd midline reject.
Additionally, look at the formation of the W M pattern [especially clear on the fast momentum indicator]. The entry brick is a triple break that increases the odds for a breakout, making this a Renko price action strategy for a 2nd trade addon.
Renko Double Midline Reject Pattern
The double midline reject is similar to the W M pattern regarding anticipated price action but is unique as a Renko price action pattern.
The chart shows the pattern formation and the 2 midline rejects – but the 2nd reject has a lower high into the trade [blue circle].
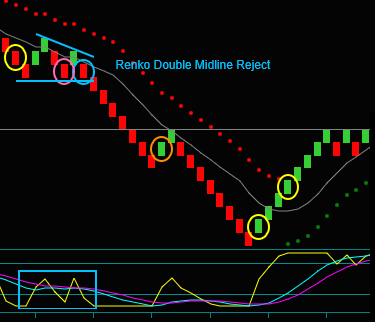
This lower high and triple break entry gives the pattern breakout price action. Look at the trade entry sequence:
- Yellow circle price envelope reverse sell.
- Purple circle midline reject sell addon.
- Blue circle double midline reject sell addon2.
The double midline reject with price action breakout potential even greater than the W and M pattern makes this a Renko price action strategy used as a 2nd addon trade.
The chart also shows 2 anticipated price action-reaction trade filters:
- The orange circle is a price extreme reverse buy, but it is into the resistance price – left side double top bought across the chart. The price action is a reject that continues the sell swing.
- The next yellow circle is a price extreme reverse buy followed by a price envelope reverse buy addon.
- These are ‘base’ Renko indicator trades, not price action pattern trades.
- Note the right side of the chart – do you see a W pattern?
Although there is a W pattern, you would not trade it. Like the orange circle, you would filter for the resistance price with the anticipated price action as a reject instead of a breakout.
Renko Price Action Or Price Movement
We have discussed the important difference in trading between Renko price action and price movement.
You can see up and down price movement and bricks changing colors on a chart. But this price movement alone isn’t important regarding reversal, continuation, or breakout.
In contrast, reading price action with Renko charts, especially including patterns, can be very tradeable.
Renko price action patterns, like triangles and wedges, are breakout patterns that often lead to big price moves after sideways moves with very little momentum. And price action patterns like the W and M pattern and the Renko double midline reject are addon trade strategies based on momentum leading to price continuation.
Additionally, price action is important in trading because of the reactions you can anticipate. For instance, you can anticipate trades taken directly into price support or resistance to reject the price and reverse. Or you can anticipate trades taken against momentum to stall or reverse.
You have seen from the chart examples and videos that the benefits of Renko price action can be significant for swing continuation after trading breakouts or avoiding trades that have increased odds of losing.