What is Renko Day Trading?
Renko day trading uses indicator and chart pattern strategies for making multiple relatively short-term intraday trades. The Renko chart type is effective for day trades because they are based on price changes only.
As such, day trading with Renko charts takes advantage of the price-only brick construction to capture the more frequent price movement and swings characteristic of this style of trading.
The Renko bricks work well due to the chart’s sensitivity to price changes. Price action that can be seen on these charts is important because day trading involves trading in either direction, regardless of a multi-day trend.
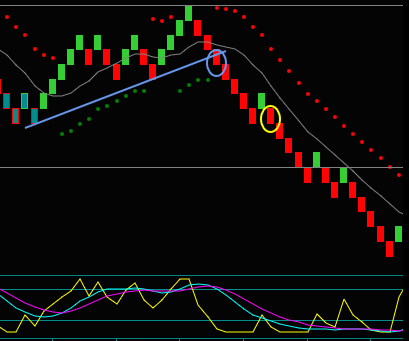
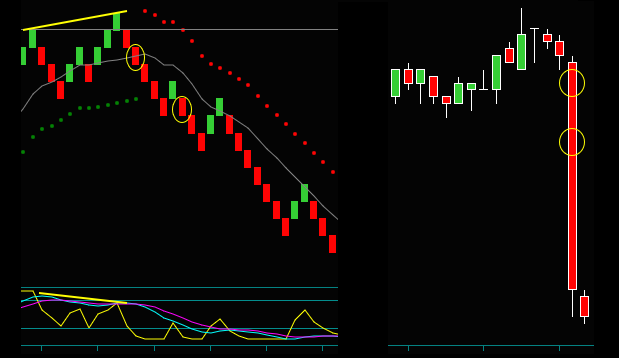
For instance, look at the Renko day trading chart below. You have price action where there was a reverse after the test of resistance [gray line double top]. The 2 circles are then short day trades – you would not want to miss these trades because there is a daily uptrend.
Why Renko Day Trading Charts?
And especially compared to time or volume bars, Renko charts work better for day trading.
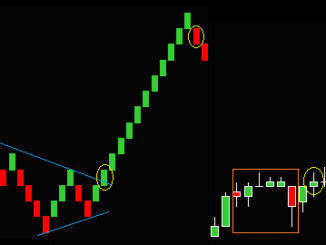
The chart example below shows a key takeaway for Renko day trading compared to timeframe candlestick day trading – those of price sensitivity and chart clarity:
- The yellow circles show 2 of our Renko strategy day trades.
- You see the same yellow circles on the candlestick chart.
- Look at how much clearer the Renko bricks are for day trade setups – could you possibly trade the candlestick chart?
Using price movement and the effect momentum has on the change in price has been key to developing Renko chart indicators and trading strategies. I have found that indicators based on momentum are the best for our Renko day trading strategies.
Again, remember that Renko contrasts with traditional chart types that plot price against time. Timeframe charts show whatever price occurs for the time setting. Renko charts make new bricks based on a set change in price. The Renko bricks can show price action not seen in a timeframe chart, like some traders’ 1 or 5 minute bars, which is important for day trading.
You want Renko day trade indicators and strategies that take advantage of multiple up-and-down swings and reversals. You hold the trades for relatively short periods.
The objectives for Renko day trading are more frequent trades intraday in either direction. Again, these are not trades you hold overnight. This contrasts with position trading and possibly holding for a big trend over many days.
Renko Day Trading And Strategy Objectives
Renko day trading is an approach to trading the markets that focuses on capturing short-term price movements. Unlike position trading, concerned with larger trends and fundamental analysis, day trading with Renko indicators and charts uses strategies for frequent swing changes and technical analysis.
The difference in objectives further defines Renko day trading.
For instance, consider a position trading strategy in a strong uptrend. You would not sell a trend reverse. Instead, you would wait for this sell reverse to reverse and buy with the trend.
Position trading also looks at the concept of overbought and oversold. For day trading, I look at price and momentum extreme analysis.
I think about price direction and extremes for Renko and day trading. I want technical indicators for additional trading opportunities in both directions, capturing shorter-term price moves and using momentum to lead the price. You do not want lagging indicators for day trading.
Do Not Day Trade With Position Trading Biases
When day trading, you want to do this without the biases position trading would have for counter trend [direction].
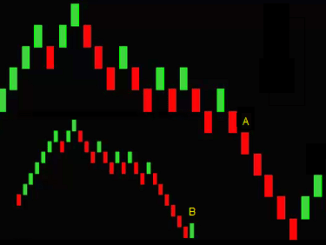
Look at the Renko day trading chart below. The chart covers around 2.5 hours of price movement. You can see multiple price swings, including the biggest, an upswing – that then reverses into a downswing almost as large.
Assume that this is a daily bar chart. You could call this an uptrend if you were position trading and compared the big buy swing to the smaller sell swing that began the chart. Consequently, you may not trade the short and wait for the next buy.
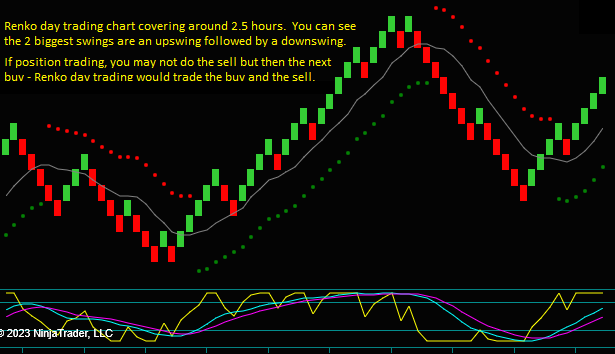
Renko day traders would trade the buy and the sell just like they would trade the other setups during this period.
Trading intraday accepts the objective of more trades that last a shorter time. Some days have fewer trades and bigger swings, while some days have a greater number of trades. Profitability would ideally occur from the sum results of all the trades.
These are not position trades that last multiple days or more. Renko day traders avoid the risk of holding positions overnight.
Do You Understand Renko Chart Basics
You can’t Renko day trade without knowing how the charts work. Understanding Renko chart basics is necessary to select the trading indicators and strategies for using these charts.
Unfortunately, if you Google ‘what is a renko chart’, you may misunderstand important basics due to some search results. You must clearly understand how Renko charts work.
Consider things that came up in the search:
- Renko charts have a distinctive brick-like structure that filters out minor price fluctuations. The bricks remove ‘market noise’ from the chart, making it easier for traders to identify important trends and patterns.
- Each brick on a Renko chart represents a predefined price movement, and you only get a new brick when the price moves by this predefined amount. This unique feature makes identifying and following trends easier, which is crucial for day trading.
- False signals can occur when the market reverses direction before the price movement reaches the brick size. In such cases, the reversal will not be represented on the Renko chart, potentially leading to missed trading opportunities or unexpected losses.
- Renko charts are also prone to false signals when there is choppy price action in the market, leading to up-and-down bricks alternating multiple times.
Clarifying How Renko Charts Work
Yes, you make Renko charts from bricks that have fixed settings. And since price movement smaller than the setting will not make a new brick, these prices appear filtered from the chart.
- Understand that the prices are only missing from a completed classic Renko chart. You can see these prices using a Renko chart with price wicks. And all prices and price action is seen on all Renko charts in real time.
But what if the smaller [minor] prices were missing – would this make it easier to identify important trends and patterns?
- I mentioned that I didn’t consider the trend when Renko day trading. Regardless, I do not see how a trend would be clearer because prices were missing. Or how day trading would be more effective when you couldn’t see all price action.
Should Renko false signals occur from a price reverse smaller than the brick setting, and would this cause missed trades?
- Renko charts are no different than any chart type. You can have up and down prices while the brick or bar completes. Afterward, you will know the brick or bar direction.
- You do not have a reversal brick from price action intra-brick. And I would not trade our Renko day trading strategies and setups before you had a completed brick.
Do Renko day trading charts give false signals in choppy price action?
- To begin with, do your Renko strategies or indicators give a false signal if it becomes a losing trade? I would answer this no – all charts and strategies will have trade losses.
- Choppy price action and market consolidation are virtually untradeable. Our trading strategies seek to avoid trading during these conditions, and it is a Renko chart positive to see consolidation.
Renko Chart Real Time Bricks
Look at the chart below – you are looking at a real time Renko brick while it is being made. I used the price wick chart because I want you to see that you miss no prices.
At this point, here is the price action for the current brick that has a setting of 3 ticks:
- The previous brick closed as an up brick, so it closed at its high – the current brick is down 1 tick.
- The current brick was 2 ticks lower than the previous brick – it would need to have gone 3 ticks lower to close as a red brick.
- The current brick was 2 ticks higher than the previous brick – it would need to have gone 3 ticks higher to close as a green brick.
Also, can you see how there is a price wick above and below the last brick? When this brick completes, you will only see a wick on one side of the brick.
This brick has 8 ticks of potential price action. If the brick completes as an up brick, you have the 3 ticks brick setting + 3 ticks from the previous up brick + 2 ticks below the low of the previous brick. And again, you are seeing all of these prices in real time.
Click on the link to see a recording of this Renko day trading chart brick complete:
Renko Bricks Real Time
NinjaTrader Renko Charts Trading Platform
I use the NinjaTrader platform for Renko charting. Besides being a charting program, NinjaTrader provides a coding language.
I don’t use basic trading indicators that come with the program, like moving averages, MACD, or RSI, for Renko day trading – instead, writing custom Renko momentum indicators that ‘fit’ our trading strategies.
And although the NinjaTrader Renko charts are the classic type, you can code Renko custom bricks to see the price wicks.
NinjaTrader is available as a free download, and the charts are easy to set up and use. Do note that you will need a data source to make charts. Many are available, but be sure you are getting tick data – Renko charts will not work with only time data.
Renko day trading charts are easy to make:
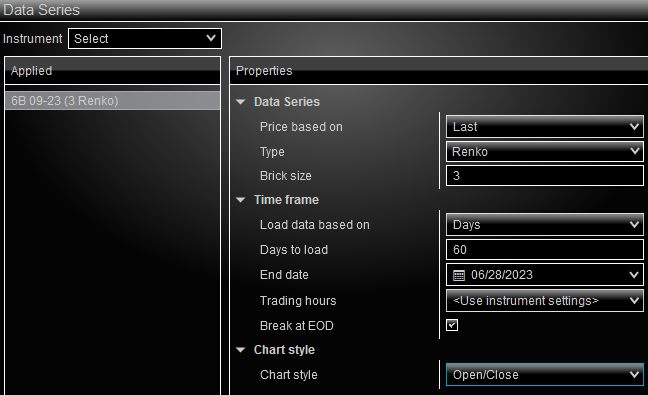
- Select a new chart from the NinjaTrader main menu – this will pull up the dialogue box below
- Select your trading instrument – you can see the NinjaTrader symbol for the British Pound
- Now select your chart properties
- Select Renko for the chart type and use a brick size of 3.
- You will base the chart on the last price, and the style for a completed brick will be to show the open and close.
- You can load as many days as you want, and there are other choices you can select, like the brick size and color.
Renko Brick Setting For Day Trading Charts
The brick size in Renko charts plays a critical role in determining the sensitivity of the chart to price changes. You must adjust your brick setting based on your day trading strategy.
You will use a smaller brick size for Renko day trading since the focus is on shorter-term price movements. On the other hand, position trading would use a larger brick setting or a higher time frame for a bar chart. Here the focus is on longer trends.
I typically use a 3 tick brick setting for Renko day trading the British Pound. A smaller setting allows the chart to capture more swings and trading opportunities.
Do note the smaller brick setting will also result in more bricks to analyze and trade. Or more bricks that could become undesirable swing reverses. Balancing the chart sensitivity and its effect on your Renko strategies and indicators would be best.
When studying brick settings and how frequently this indicator reversed, I wanted to capture the bigger swings before they reversed. However, I also didn’t want a big delay in tradeable chart reverses that caused missed trades.
You should experiment with different brick sizes and adjust them for your trading strategies and what you are trading. But know that there is no perfect brick setting, and there are tradeoffs to consider.
The objective is to choose a brick size that allows you to capture the price swings that are most relevant to your trading strategies and objectives.
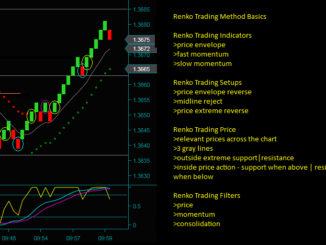
For our Renko day trading strategies, a price envelope indicator ‘controls’ the trading direction on the charts. I think of this as the ‘Renko chart mode’.
I want to balance the frequency of indicator reverses and the trading swing size before a reverse.
Renko Day Trading Charts And Indicators
Using the charts below as an example, I want to show our custom Renko momentum indicators for our day trading strategies. I have found that momentum is the best Renko trading indicator.
We are using 3 different momentum indicators for Renko day trading. These indicators all provide different ways of analyzing the charts.
I am not suggesting that all Renko charts look like these examples. But these are like the price swings I studied when developing the indicators and strategies and selecting the brick setting. These are the kind of price swings that can maximize the results for Renko day trading.
Since the Renko price envelope determines the chart mode and trading direction, can you capture the biggest swings without reversing:
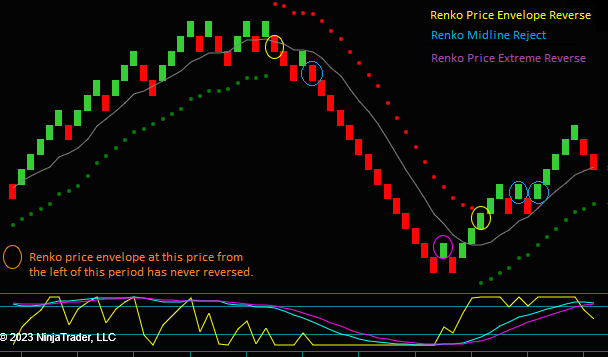
- In chart1, the biggest swing is the yellow circle buy – the price envelope remained in buy mode for around 1 hour.
- In chart2, the biggest swing is the orange circle buy that started to the left of this period – the price envelope remained in buy mode for around 5 hours.
- It is unusual for a Renko day trading swing to last that long, but it’s also important that it did.
- On chart2, the second biggest swing [essentially the same size as the buy] is the yellow circle sell – the price envelope remained in sell mode for around 1.25 hours.
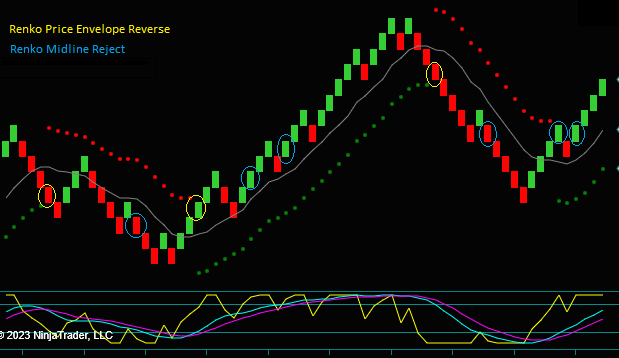
British Pound Renko Charts
The first chart is the British Pound future contract, using a Renko 3 brick setting. The blue and yellow circles correspond with the trade setups during this period, around 2.5 hours.
The second chart is the British Pound future contract, using a Renko 3 brick setting. This chart period is around 5 hours.
Again, the blue and yellow circles show momentum reverse and midline reject trades setups in the direction of the Renko price envelope. And added to this chart is our third Renko day trading indicator setup, the price extreme reverse.
Renko Custom Momentum Indicators For Day Trading
Our Renko day trading charts and strategies use 3 custom momentum indicators.
Price Direction And Continuation
- Renko price envelope reverse [yellow circles]
- The price envelope ‘controls’ the direction or mode for the chart – red dots on the top are sell mode, and green dots on the bottom are buy mode.
- The momentum aspect of this indicator is the difference for time frames – when it is positive, the dots shift to green, and when it is negative, the dots shift to red.
- The price envelope reverse triggers when the dots shift color if the slow momentum indicator [blue-purple lines below the chart] has also crossed.
- Like all of our trade setups, there are at least 2 setup components – none of the Renko day trades are single indicator trades.
- Renko midline reject [blue circles]
- The Renko midline reject is a trade setup for price continuation. One of our day trading strategies is making addon trades on the bigger swings – this is the trade setup used.
- The trades are done in the mode of the price envelope and include a retrace to the gray midline ahead of the trade.
- There are 2 momentum components for this trade (1) the blue-purple lines continue in the direction of the price envelope during the retrace, and (2) the yellow line, which is a fast indicator, breaks back or above the extreme line – this is called a fast momentum hook.
Price And Momentum Extreme Reverse
- Renko price extreme reverse [purple circle – look on the 2nd chart]
- We base the first 2 Renko day trade setups on momentum becoming positive or negative + the continuation of momentum.
- The price extreme reverse is a reversal setup. And because of the extreme seen in price and momentum, this is a trade you can make before the price envelope reverse.
- The 2 setup components for this trade are (1) the 2 slow momentum indicator lines must both be above or below the extreme line and (2) there must be 5 or more consecutive bricks of the same color.
Renko Day Trading – A Unique Approach
Renko day trading offers traders a way to trade by focusing on price movement rather than time or value.
Be sure you know the basics of Renko charts and how they work. Also, understand different misnomers you see written about day trading this chart type.
For instance, I have continually read that Renko charts miss prices and that seeing choppy market conditions is negative. Or, how you can get Renko false signals before a brick completes. I have discussed why I don’t think these things are correct.
Like all trading strategies, Renko day trading will have challenges and a learning curve. But, by using this approach, you can combine custom momentum indicators and strategies for capturing the short-term price swings typical in day trading.