Momentum is the best Renko indicator for trading and our strategies. The reason for this is that Renko charts are price charts only. And there is a strong relationship between momentum and price direction.
Renko Indicators And Trading Strategies
Finding the best Renko indicator will be of major importance when using Renko charts for trading. However, this would lead to the question – are Renko charts even tradeable with indicators?
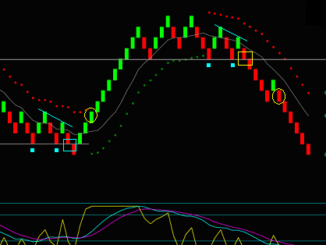
| The chart below shows price upswings and downswings. Where would you enter these trades? Can you trade Renko charts by price action only? |
Again, would you know where to enter the trades? Some may answer this question yes. But I would not know how to do it, especially not for day trading. I learned that it is best to trade Renko charts with indicators.
You could try a lot of indicators for a Renko trading strategy, and I did. Your charting program is full of them; here are some to consider:
- Time indicator
- Volume indicator
- Channel indicator
- Trend indicator
- Reversal indicator
- Momentum indicator
But what is the best indicator for learning to trade with Renko charts?

What Indicators Do Not Work On Renko Charts
To begin with, how do Renko charts work, and what is a Renko chart? And are there indicators that won’t work with this chart type?
Renko charts and the bricks you see making up the charts are based on price only. What is a price chart? And how do you make Renko bricks?
Knowing this is necessary for trading these charts.
Making Renko Charts
You have been looking at a 3 brick Renko chart. This means that every brick on the chart is 3 price ticks. The chart makes a new brick in the following ways:
- Red bricks complete 3 ticks lower than the low of the last red brick. Or, they complete 3 ticks lower than the low of the last green brick.
- Note: since green bricks close at their high, a red brick completes 6 ticks below this price.
- Green bricks complete 3 ticks higher than the high of the last green brick. Or, they complete 3 ticks higher than the high of the last red brick.
- Note: a green brick completes 6 ticks above this price since red bricks close at their low.
There is a time scale below the Renko charts. However, this is the time of day only. These times are not the frequency for the bricks.
And, since Renko charts are price charts only, volume is also not a factor in making bricks. Therefore, do not use the following indicator types for Renko chart trading:
- Based on time
- Based on volume
| Trying to trade with a Renko time indicator or a renko volume indicator would be useless and, thus, couldn’t be the best indicator for Renko charts. |
What Is A Momentum Indicator
What is momentum, and why are momentum indicators the best to use with Renko charts?
Momentum in trading measures the amount or rate of price change over a given period. For instance, the formula for a basic momentum indicator:
- Consider momentum for the last 10 trading periods or, in the case of a Renko chart, the last 10 bricks.
- Momentum = C – Cx
- C is the last price, and Cx is the closing price 10 periods [or bricks] ago.
- If the difference is positive, momentum is increasing.
- If the difference is negative, momentum is decreasing.
|
By definition, momentum is useful in determining the strength or weakness in the current direction of the price. This is especially the case when momentum leads to price continuation. Additionally, momentum shows how far the price has moved and whether it has become extreme. This is particularly useful when trying to determine whether the current price will continue its direction or reverse. |
Along with indicators, momentum and price can make renko chart patterns useful for trading. A price momentum divergence pattern is a reversal pattern. It occurs as follows:
- Price makes a higher high, but momentum makes a lower low.
- Price makes a lower low, but momentum makes a higher low.
Renko charts are price only, and momentum can show the direction and continuation or reversal of price. These characteristics help make momentum the best Renko indicator.
Renko Trading Momentum Indicators
For my Renko day trading strategy, indicators that are based on momentum are the best.
But how to read a momentum indicator? How do you trade Renko charts besides using the basic formula C – Cx?
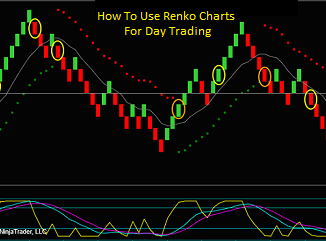
The chart below shows our 3 Renko momentum indicators; the yellow circles indicate the method setups during this trading period.
|
Each of these indicators uses a different momentum calculation. And this is important to note. The Renko chart trade setups are not using 3 momentum indicators that are the same; I do not think the redundancy would be beneficial. |
Instead, each indicator has a different calculation. And each of the 3 indicators has its own Renko momentum strategy:
- Initial chart reverse from buy to sell or sell to buy
- Price continuation after a retrace
- Price reverse after an extreme or divergency
And for further differentiation, each trade setup uses 2 momentum indicators as components.

Momentum Price Channel
The indicator on the chart is a price envelope ‘fitted’ around a moving average [gray line].
Why is this a momentum indicator? Because the difference between a short and moderate length of the last prices [basic C – Cx calculation] causes the envelope dots to change colors.
The Renko strategy for this indicator is for the ‘chart mode’ Red dots on the top show sell mode, and green dots on the bottom show buy mode.
Look at the yellow circles corresponding with the price brick where the dots shift colors. I call this setup the Renko price envelope reverse. This is the initial trade in a price swing change.
- Examples: yellow circles 1,3,6,7
Fast Momentum
This indicator is the yellow line below the chart. It is a fast momentum oscillator that uses the RSI [relative strength] low and high for a given number of bricks in its calculation.
The scale is only 0-1, so small price moves will quickly take this indicator from one extreme to another. And the speed of movement is the basis for using this for a Renko strategy I call a fast momentum hook.
The hook is an indicator Renko price action pattern that resumes the direction of slow momentum after a counter-price retracement. The pattern indicates the continuation of the price envelope direction. Therefore, the fast momentum hook is an add-on trade setup.
- Examples: yellow circles 2.4
Slow Momentum
I started trading in 1995, selling OEX option spreads. The objective was to sell a call and a put spread around 1.5-2 standard deviations from the last price for a $3.50 credit.
| And then, I read a book about momentum, direction, and divergence. I learned about smoothing and double smoothing and how to read a momentum indicator as a price proxy – leading to momentum becoming the best Renko chart indicator. |
The result was the slow momentum indicator – the blue-purple lines below the chart. Now I could time the option selling at price and momentum extremes and started collecting $5.00, or even more, for the two spreads.
This slow momentum indicator has been on my different trading charts for all these years. I call this indicator MEx.
It is an oscillator with a range of -100 to 100. I especially like momentum indicators that have fixed ranges because they show the maximum high or low.
Ways I use MEx for trading Renko charts:
- Price swing and momentum extremes
- Price momentum divergences
- Momentum flow or direction on price retracements
- Example: MEx is a setup component for all setups
Best Indicators For Renko Charts Video
Renko Momentum Indicator Video1
I want to discuss further why momentum is the best Renko indicator in a trading video. The Renko trading video is going to focus on the following:
- Our Renko momentum indicators
- Renko strategy trade setups and the multiple momentum components for each setup
- Introduction to trading filters
- What is a trade setup filter?
- Because of the filter, one of the setups isn’t tradeable
Click the link to watch the video: What Is The Best Indicator For Renko Charts
Renko Momentum Indicator Video2
A 2nd video will also compare the MEx indicator to two widely-follow momentum indicators, MACD and RSI.
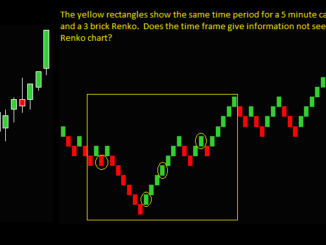
The Renko chart below shows all three of these, with 4 points labeled. I want to compare the characteristics of the 3 different indicator types.
And then, I want to discuss what each indicator would show during the trade setup. These explain why I like the MEx momentum indicator better than MACD or RSI for Renko trading.

Click the link to watch the video: Comparing MEx MACD RSI As Renko Momentum Indicators.