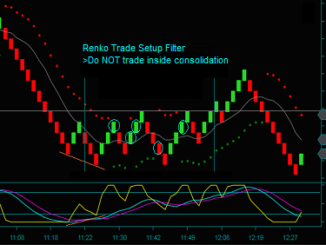
Renko trading prices are significant because they refer to chart resistance or support. And trading into these areas lowers the odds of a method trade setup. This is because resistance and support prices are locations on the Renko chart where trading swings often reverse direction. There is no trade without a Renko price breakout setup.
As such, avoiding trades in these areas can eliminate losses. There must be at least 3 bricks between a Renko trading price and a method trade setup. Otherwise, this is a filtered setup; no trade will be made.
What Makes Renko Trading Prices Significant
A Renko trading price is most significant when it has had previous price action. To identify Renko chart prices, I am looking for the retest of price extremes leading to a swing reverse. Prices that have been both support and resistance, a method shift line, are also significant.
These are areas on the chart to avoid trading without a Renko breakout setup. For instance:
- Price swing double tops and double bottoms that led to a swing reverse
- Daily highs and daily lows, especially when they exceed the previous day’s high or low
- Shift lines
- Resistance prices that broke and then held as support
- Support prices that broke and then held as resistance
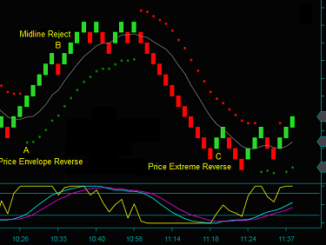
The first thing to note on the chart below – these Renko trading prices were located to the left of the chart. The location of the prices is not related to what you currently see on the chart. This is the retest [reaction] of these left-side prices.
The reaction is a good example of why price as a trade setup filter is an important Renko method strategy.
What Is A Renko Price Breakout
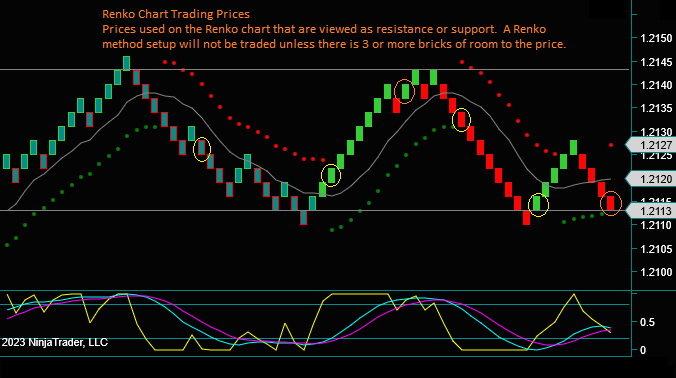
Look at the 2 Renko trading prices in the chart range now traded:
- The top line was a price swing double top. This is the retest as a resistance price.
- The bottom line was also a price swing double top. This is the retest as a support price.
Now, look at the circles on the charts. They are all Renko method trade setups. However, only the yellow circles are tradeable. So why aren’t the orange circles trades?
- The setups do not have 3+ bricks of room to price.
- What if Renko chart prices typically [more than 50 percent of the time] hold or reject?
- The orange circles would be Renko price breakout trades only. This means that resistance or support prices would have to break out to become a profitable trade.
- And in this case, there was no price breakout. Instead, there was a reverse and a loss if traded.
A breakout of Renko trading prices only is not a Renko price breakout trade setup.
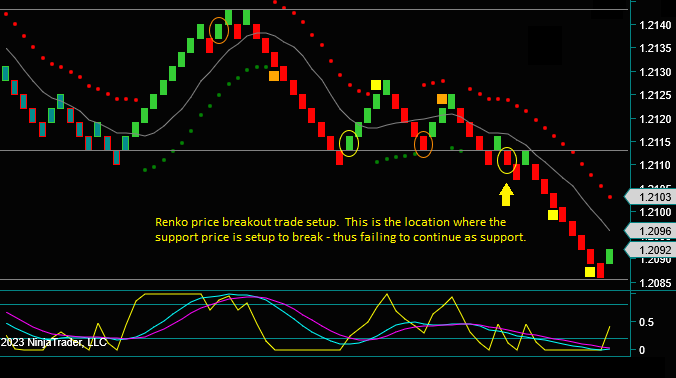
Renko Price Breakout Trade Setup
The setup for a Renko price breakout is trading the ‘failure’ of the Renko trading prices. So what does this mean: where-how does the support or resistance price fail to be support or resistance?
Look at orange circle2 and yellow circle2 on the chart below:
- Orange circle2 is a price breakout only.
- Yellow circle2 is a price failure break, the setup where the Renko trading price fails as support.
- In ‘method language’, this setup is a price break2 with mex flow [defines a price failure break], with additional breakout potential from a triple bottom break.
- These are momentum components to differentiate between a price breakout and a price failure.
Click on the links below for a Renko Trading Prices And Breakout Setups video discussion about the following:
- Renko trading prices and their significance
- Renko price breakouts only as filtered trades
- Renko price failure and breakout setups