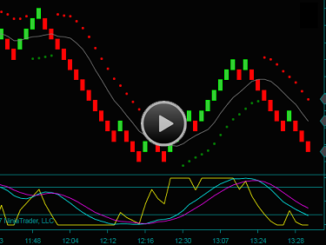
Renko chart trading price greatly affects the decisions made in our day trading method.
I observed the significance of trading prices. And when developing our day trading method setups, I viewed them in the context of the next price that would act as support or resistance – always asking the following questions:
- Why is this price relevant?
- How many other traders are also looking at this price?
- Has there been trading price action the last time at the same price area?
Finally, and most importantly, can I take the trade into this Renko trading price?
Renko Chart Trading Price Evaluation Video
I will discuss the following chart in the Renko chart trading price video. There will also be a focus on the Renko chart prices and their effect on trading decisions.

To begin, look at the yellow circle on the Renko trading chart. It should be clear that this is a price envelope reverse buy trade setup.
However, I cannot take that trade until I know where the next resistance price is located. In our Renko method, we will not take a trade that does not have at least 3 bricks of room to support or resistance. It becomes a price-filtered trade.
The Renko chart trading price is at the gray line, which is significant since it’s a daily high. Therefore, this price is 4 bricks from the trade setup; I can take the trade.
Look at the blue circle; another Renko chart trade setup called a price extreme reverse. This time the trade entry would be directly on top of the gray line, which shifts to support after breaking – so I did not take this trade.
What Determines The Significance Of A Renko Chart Price
Now think of price action at the gray line, especially in the context of all the other traders looking at this chart. This is significant when locating a Renko chart price. After all, how can we make a price-based trading decision if no one else is looking at the same price?
This trading price doesn’t hold as support, but it doesn’t reject as resistance either. Instead, the price continues to straddle and go into consolidation.
There are no new trades. Do not trade inside of consolidation. The profitable buy is higher than the consolidation area low. It is still long at the new high.
Now consider the Renko chart for price after the gray line broke. There is a new high, so consider the price trading concept that when resistance breaks, it shifts to support. Do you think each new brick high is a support price after it breaks, and you should have new Renko trading prices at each blue line?
How would you ever trade if you continued to do this? Your chart could become so full of prices that you wouldn’t see the Renko bricks anymore. And what about all the other traders? Do they have trading prices at each of these points too? And when you answer, remember that chances are they aren’t trading Renko charts and are trading bar charts of different time frames or tick counts.
For my Renko trading prices analysis, I will continue to watch the original gray line, and then I will put a new resistance price at the high of the chart after it reverses and it is clear that the swing is over.
Trading Price Filter Followed By Price Failure Break
You cannot go short at blue circle2. The price envelope reverse occurs a brick above the gray line. It is a price-filtered trade. Enter the trade at yellow circle2, and the price failure break. This is where price support is failing to as support.
Momentum confirms the trade with a fast momentum hook and slow momentum flow. Yellow circle3 is another Renko chart trading price-related trade. This is an addon trade.
You can see how price relates as it tests and rejects between the yellow circles. Also, look at the fast momentum hook and slow momentum flow, again indicating price continuation.
Finally, I want to talk about one more Renko trading price that would be on my chart at the gray bottom line. Why is this Renko price on the chart? And when did it become relevant, since it wasn’t already on the chart like the top gray line?
Look at the red brick on the left side of the chart. This Renko trading price is the sell swing low before the reverse to the higher highs.
This is an interesting price action concept. Observe how frequently these prices act as support. Other traders are seeing this same price area.
The support price breaks and shifts to resistance. Blue circle3 is not a price extreme reverse buy. There are partial profits, and the trade is still short at the last brick of the chart.
Click the link to watch the video: Renko Trading Price Evaluation.


Be the first to comment